
3 Asian Stocks Estimated To Be Undervalued By As Much As 44%
As global markets closely monitor potential interest rate changes and economic indicators, Asian stock markets are showing mixed performances with some regions experiencing growth while others face contraction. In this environment, identifying undervalued stocks becomes crucial for investors seeking opportunities; these stocks often present a strong balance sheet and potential for growth despite broader market challenges.
Top 10 Undervalued Stocks Based On Cash Flows In Asia
| Name | Current Price | Fair Value (Est) | Discount (Est) |
| Xi'an NovaStar Tech (SZSE:301589) | CN¥153.00 | CN¥302.28 | 49.4% |
| Xi'an International Medical Investment (SZSE:000516) | CN¥4.72 | CN¥9.38 | 49.7% |
| Wuhan Guide Infrared (SZSE:002414) | CN¥12.59 | CN¥25.15 | 49.9% |
| Sinolong New Materials (SZSE:301565) | CN¥28.19 | CN¥55.57 | 49.3% |
| Nan Juen International (TPEX:6584) | NT$346.50 | NT$687.11 | 49.6% |
| JUSUNG ENGINEERINGLtd (KOSDAQ:A036930) | ₩29050.00 | ₩56951.72 | 49% |
| HD Korea Shipbuilding & Offshore Engineering (KOSE:A009540) | ₩447500.00 | ₩892280.49 | 49.8% |
| COVER (TSE:5253) | ¥1569.00 | ¥3100.50 | 49.4% |
| China Ruyi Holdings (SEHK:136) | HK$2.45 | HK$4.82 | 49.2% |
| Beijing Beimo High-tech Frictional MaterialLtd (SZSE:002985) | CN¥27.94 | CN¥55.75 | 49.9% |
Let's review some notable picks from our screened stocks.
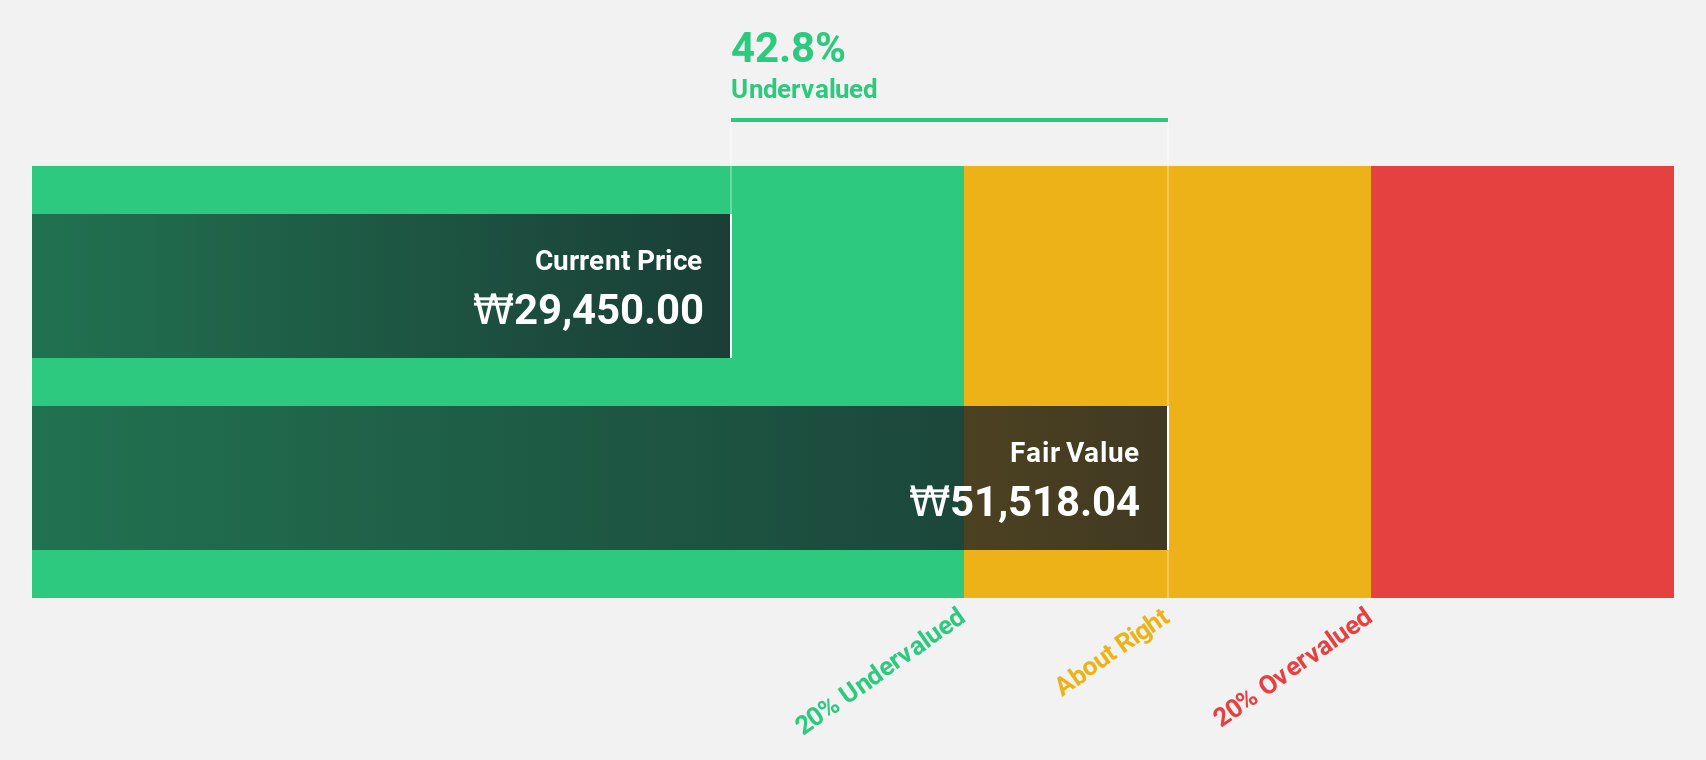
STI (KOSDAQ:A039440)
Overview: STI Co., Ltd. operates in the semiconductor equipment industry in Korea, with a market cap of approximately ₩424.43 billion.
Operations: The company generates revenue primarily from its Semiconductor Equipment and Display Equipment segment, totaling approximately ₩373.20 billion.
Estimated Discount To Fair Value: 44%
STI Co., Ltd. appears undervalued based on cash flows, trading at 44% below its estimated fair value of ₩51,452.01. Despite recent volatility in share price, the company has shown robust revenue growth, with a forecasted annual profit increase of 48.82%, surpassing market expectations. Recent earnings reports highlight improved quarterly net income and sales figures compared to last year, although nine-month net income saw a slight decline. An annual dividend of KRW 200 per share was affirmed for April 2026.
- Our earnings growth report unveils the potential for significant increases in STI's future results.
- Unlock comprehensive insights into our analysis of STI stock in this financial health report.
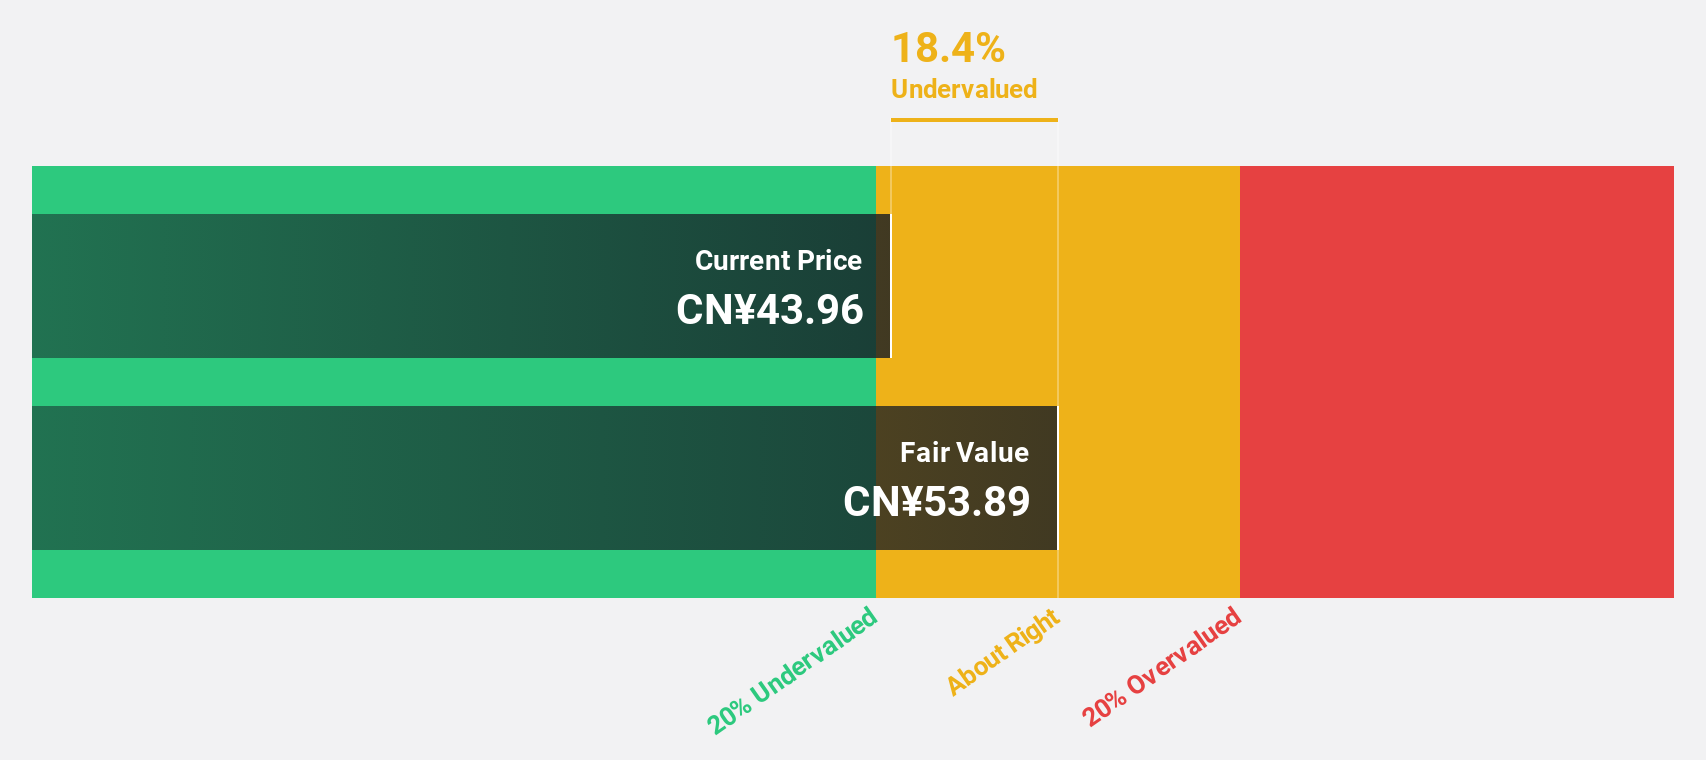
Electric Connector Technology (SZSE:300679)
Overview: Electric Connector Technology Co., Ltd. specializes in the research, design, development, manufacture, and sale of micro electronic connectors and interconnection systems globally, with a market cap of approximately CN¥19.86 billion.
Operations: The company generates revenue from the research, design, development, manufacture, and sale of micro electronic connectors and interconnection system related products across various regions including China, North America, Europe, Japan, and the Asia Pacific.
Estimated Discount To Fair Value: 39.1%
Electric Connector Technology Co., Ltd. is trading at 39.1% below its estimated fair value of CNY 77.86, highlighting its undervaluation based on cash flows. Despite a decline in net income to CNY 372.78 million for the first nine months of 2025, revenue increased to CNY 4.04 billion from the previous year’s CNY 3.33 billion. The company’s earnings and revenue are forecasted to grow significantly faster than the market, though its dividend coverage remains weak with low free cash flows.
- Our comprehensive growth report raises the possibility that Electric Connector Technology is poised for substantial financial growth.
- Delve into the full analysis health report here for a deeper understanding of Electric Connector Technology.
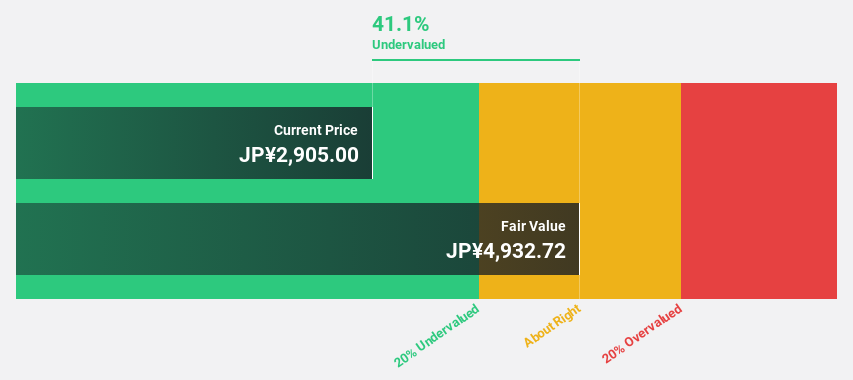
DMG Mori (TSE:6141)
Overview: DMG Mori Co., Ltd. is a global manufacturer and seller of machine tools, with a market cap of ¥380.76 billion.
Operations: The company's revenue is primarily derived from its Machine Tools segment, which generated ¥590.31 billion, and its Industrial Service segment, contributing ¥222.70 billion.
Estimated Discount To Fair Value: 31.4%
DMG Mori is trading at ¥2,734, which is 31.4% below its estimated fair value of ¥3,985.43, indicating significant undervaluation based on cash flows. Despite a volatile share price and declining profit margins from 4.5% to 1.9%, earnings are expected to grow significantly by over 20% annually, outpacing the JP market's growth rate of 8.3%. However, its dividend yield of 4.02% isn't well covered by earnings or free cash flows.
- The growth report we've compiled suggests that DMG Mori's future prospects could be on the up.
- Dive into the specifics of DMG Mori here with our thorough financial health report.
Seize The Opportunity
- Unlock more gems! Our Undervalued Asian Stocks Based On Cash Flows screener has unearthed 281 more companies for you to explore.Click here to unveil our expertly curated list of 284 Undervalued Asian Stocks Based On Cash Flows.
- Shareholder in one or more of these companies? Ensure you're never caught off-guard by adding your portfolio in Simply Wall St for timely alerts on significant stock developments.
- Enhance your investing ability with the Simply Wall St app and enjoy free access to essential market intelligence spanning every continent.
Want To Explore Some Alternatives?
- Explore high-performing small cap companies that haven't yet garnered significant analyst attention.
- Diversify your portfolio with solid dividend payers offering reliable income streams to weather potential market turbulence.
- Fuel your portfolio with companies showing strong growth potential, backed by optimistic outlooks both from analysts and management.
This article by Simply Wall St is general in nature. We provide commentary based on historical data and analyst forecasts only using an unbiased methodology and our articles are not intended to be financial advice. It does not constitute a recommendation to buy or sell any stock, and does not take account of your objectives, or your financial situation. We aim to bring you long-term focused analysis driven by fundamental data. Note that our analysis may not factor in the latest price-sensitive company announcements or qualitative material. Simply Wall St has no position in any stocks mentioned.
Have feedback on this article? Concerned about the content? Get in touch with us directly. Alternatively, email editorial-team@simplywallst.com