
Bellevue Group's (VTX:BBN) earnings trajectory could turn positive as the stock rallies 15% this past week
It is doubtless a positive to see that the Bellevue Group AG (VTX:BBN) share price has gained some 37% in the last three months. Meanwhile over the last three years the stock has dropped hard. Regrettably, the share price slid 73% in that period. So it is really good to see an improvement. The rise has some hopeful, but turnarounds are often precarious.
Although the past week has been more reassuring for shareholders, they're still in the red over the last three years, so let's see if the underlying business has been responsible for the decline.
There is no denying that markets are sometimes efficient, but prices do not always reflect underlying business performance. One flawed but reasonable way to assess how sentiment around a company has changed is to compare the earnings per share (EPS) with the share price.
During the three years that the share price fell, Bellevue Group's earnings per share (EPS) dropped by 62% each year. This fall in the EPS is worse than the 36% compound annual share price fall. So the market may not be too worried about the EPS figure, at the moment -- or it may have previously priced some of the drop in. This positive sentiment is also reflected in the generous P/E ratio of 68.23.
The graphic below depicts how EPS has changed over time (unveil the exact values by clicking on the image).
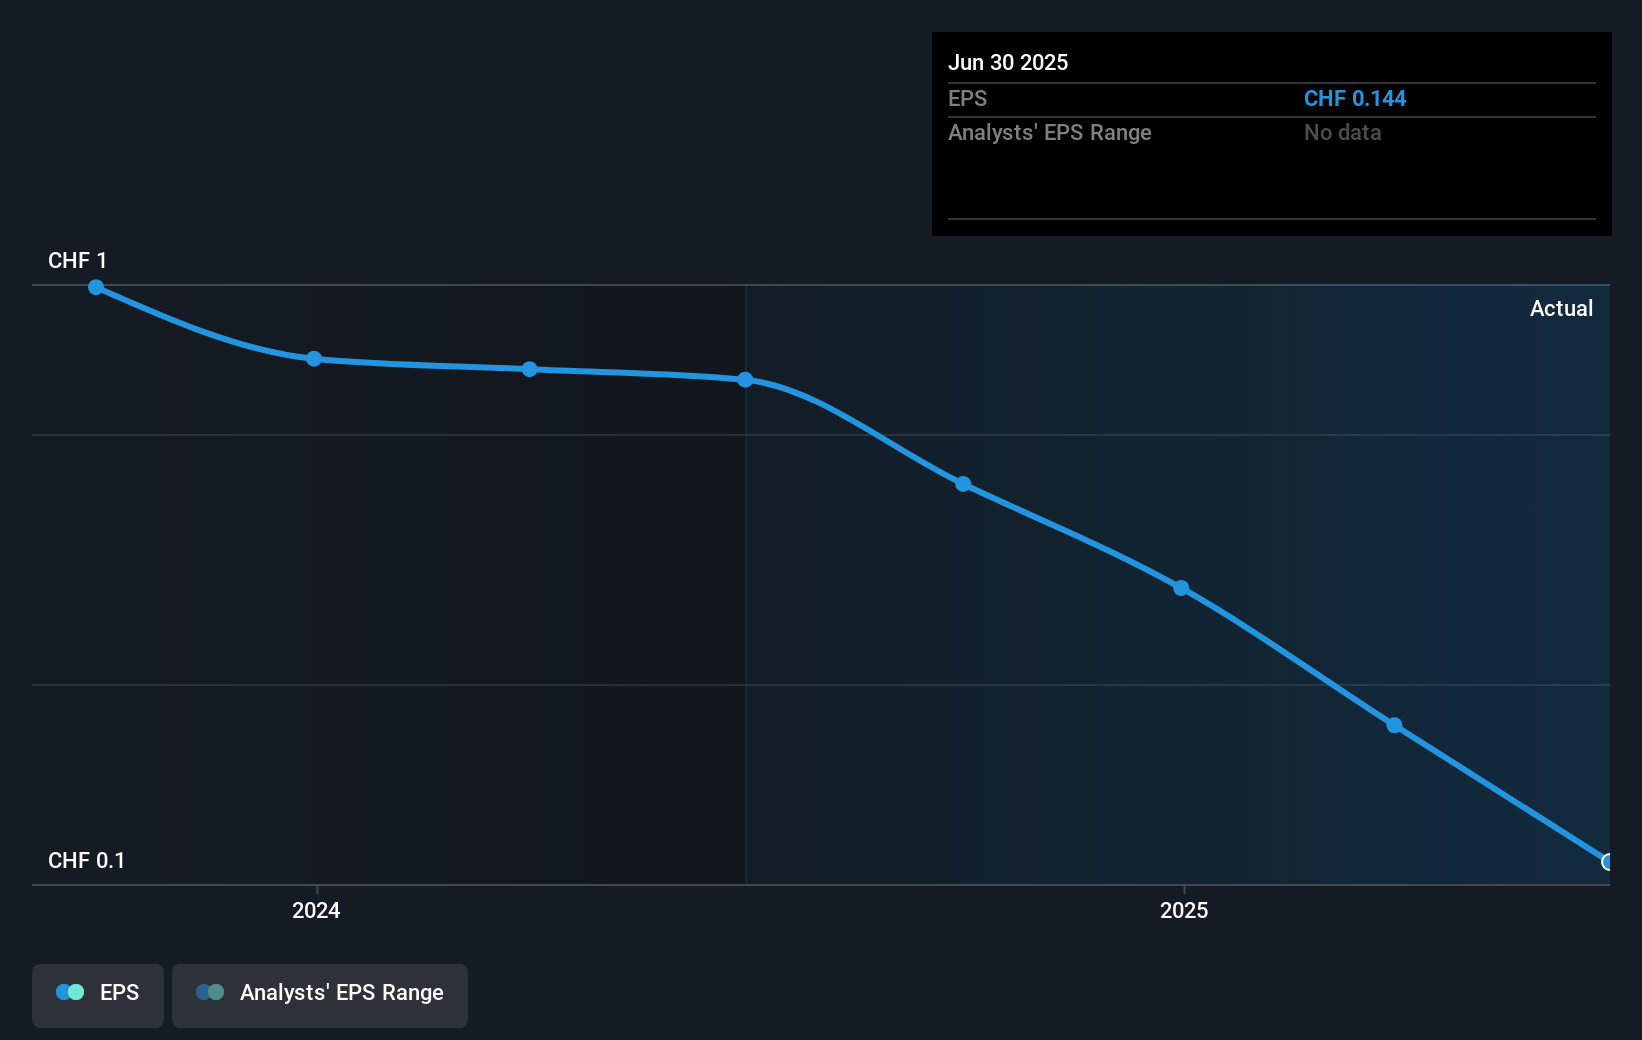
It might be well worthwhile taking a look at our free report on Bellevue Group's earnings, revenue and cash flow.
What About Dividends?
When looking at investment returns, it is important to consider the difference between total shareholder return (TSR) and share price return. The TSR is a return calculation that accounts for the value of cash dividends (assuming that any dividend received was reinvested) and the calculated value of any discounted capital raisings and spin-offs. Arguably, the TSR gives a more comprehensive picture of the return generated by a stock. As it happens, Bellevue Group's TSR for the last 3 years was -69%, which exceeds the share price return mentioned earlier. The dividends paid by the company have thusly boosted the total shareholder return.
A Different Perspective
While the broader market gained around 14% in the last year, Bellevue Group shareholders lost 9.2% (even including dividends). However, keep in mind that even the best stocks will sometimes underperform the market over a twelve month period. However, the loss over the last year isn't as bad as the 9% per annum loss investors have suffered over the last half decade. We'd need to see some sustained improvements in the key metrics before we could muster much enthusiasm. I find it very interesting to look at share price over the long term as a proxy for business performance. But to truly gain insight, we need to consider other information, too. Like risks, for instance. Every company has them, and we've spotted 4 warning signs for Bellevue Group (of which 1 is a bit concerning!) you should know about.
Of course Bellevue Group may not be the best stock to buy. So you may wish to see this free collection of growth stocks.
Please note, the market returns quoted in this article reflect the market weighted average returns of stocks that currently trade on Swiss exchanges.
Have feedback on this article? Concerned about the content? Get in touch with us directly. Alternatively, email editorial-team (at) simplywallst.com.
This article by Simply Wall St is general in nature. We provide commentary based on historical data and analyst forecasts only using an unbiased methodology and our articles are not intended to be financial advice. It does not constitute a recommendation to buy or sell any stock, and does not take account of your objectives, or your financial situation. We aim to bring you long-term focused analysis driven by fundamental data. Note that our analysis may not factor in the latest price-sensitive company announcements or qualitative material. Simply Wall St has no position in any stocks mentioned.