
0.6% earnings growth over 5 years has not materialized into gains for Creepy Jar (WSE:CRJ) shareholders over that period
We think intelligent long term investing is the way to go. But along the way some stocks are going to perform badly. Zooming in on an example, the Creepy Jar S.A. (WSE:CRJ) share price dropped 62% in the last half decade. That's an unpleasant experience for long term holders.
Given the past week has been tough on shareholders, let's investigate the fundamentals and see what we can learn.
In his essay The Superinvestors of Graham-and-Doddsville Warren Buffett described how share prices do not always rationally reflect the value of a business. One way to examine how market sentiment has changed over time is to look at the interaction between a company's share price and its earnings per share (EPS).
While the share price declined over five years, Creepy Jar actually managed to increase EPS by an average of 3.0% per year. So it doesn't seem like EPS is a great guide to understanding how the market is valuing the stock. Alternatively, growth expectations may have been unreasonable in the past.
Based on these numbers, we'd venture that the market may have been over-optimistic about forecast growth, half a decade ago. Having said that, we might get a better idea of what's going on with the stock by looking at other metrics.
It could be that the revenue decline of 3.5% per year is viewed as evidence that Creepy Jar is shrinking. This has probably encouraged some shareholders to sell down the stock.
The graphic below depicts how earnings and revenue have changed over time (unveil the exact values by clicking on the image).
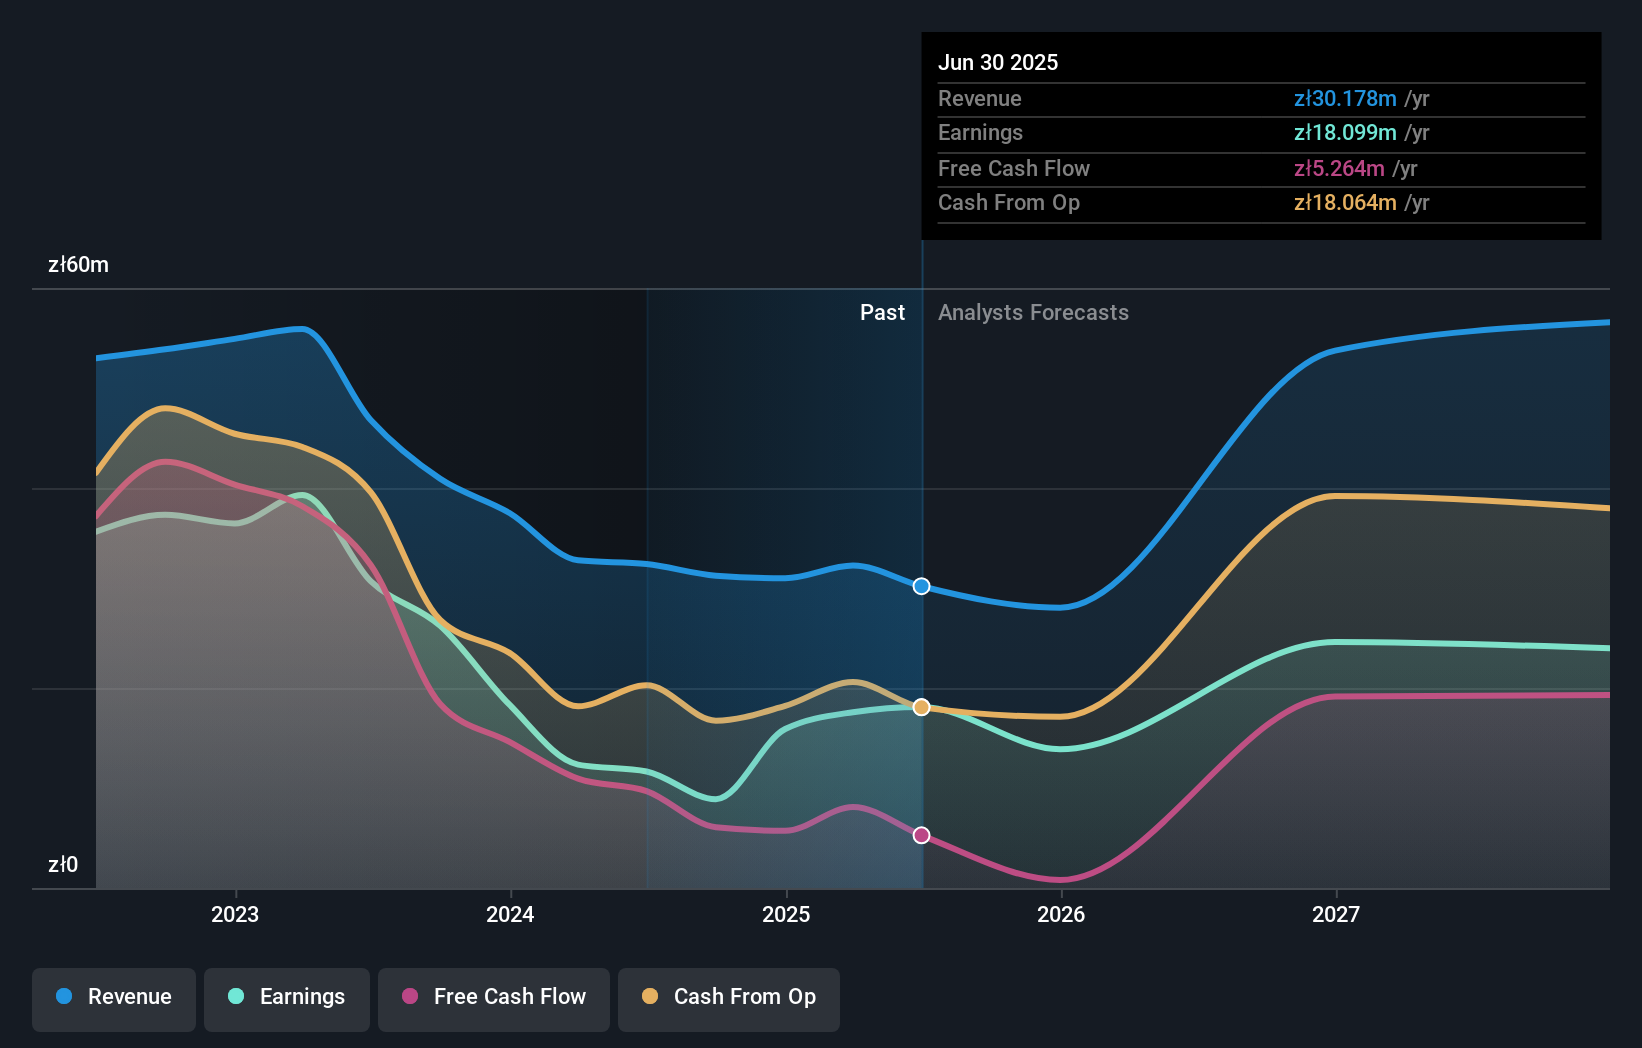
We know that Creepy Jar has improved its bottom line lately, but what does the future have in store? So it makes a lot of sense to check out what analysts think Creepy Jar will earn in the future (free profit forecasts).
What About Dividends?
When looking at investment returns, it is important to consider the difference between total shareholder return (TSR) and share price return. Whereas the share price return only reflects the change in the share price, the TSR includes the value of dividends (assuming they were reinvested) and the benefit of any discounted capital raising or spin-off. So for companies that pay a generous dividend, the TSR is often a lot higher than the share price return. In the case of Creepy Jar, it has a TSR of -56% for the last 5 years. That exceeds its share price return that we previously mentioned. This is largely a result of its dividend payments!
A Different Perspective
We're pleased to report that Creepy Jar shareholders have received a total shareholder return of 49% over one year. That's including the dividend. That certainly beats the loss of about 9% per year over the last half decade. We generally put more weight on the long term performance over the short term, but the recent improvement could hint at a (positive) inflection point within the business. I find it very interesting to look at share price over the long term as a proxy for business performance. But to truly gain insight, we need to consider other information, too. Take risks, for example - Creepy Jar has 3 warning signs (and 1 which is significant) we think you should know about.
If you like to buy stocks alongside management, then you might just love this free list of companies. (Hint: many of them are unnoticed AND have attractive valuation).
Please note, the market returns quoted in this article reflect the market weighted average returns of stocks that currently trade on Polish exchanges.
Have feedback on this article? Concerned about the content? Get in touch with us directly. Alternatively, email editorial-team (at) simplywallst.com.
This article by Simply Wall St is general in nature. We provide commentary based on historical data and analyst forecasts only using an unbiased methodology and our articles are not intended to be financial advice. It does not constitute a recommendation to buy or sell any stock, and does not take account of your objectives, or your financial situation. We aim to bring you long-term focused analysis driven by fundamental data. Note that our analysis may not factor in the latest price-sensitive company announcements or qualitative material. Simply Wall St has no position in any stocks mentioned.