
Imperial Metals (TSX:III): Valuation Check After Strong 2025 Huckleberry Drilling Results and Share Price Surge
Imperial Metals (TSX:III) just reported that every one of the nine drillholes from its 2025 Huckleberry diamond drilling program hit copper, molybdenum, silver, and gold, a clean and data rich outcome for mine planning.
See our latest analysis for Imperial Metals.
The market seems to be noticing this steady stream of positive drilling news, with the share price at CA$7.98 and a roughly 318% year to date share price return helping drive a powerful upswing in long term total shareholder returns.
If results like Imperial’s have you rethinking where the next big move might come from, this could be a good moment to explore fast growing stocks with high insider ownership.
With returns running far ahead of the broader market and fresh drilling success feeding optimism, is Imperial Metals still trading below its intrinsic value, or are investors already paying up for the company’s next leg of growth?
Price-to-Earnings of 7.8x: Is it justified?
Imperial Metals last closed at CA$7.98, and on a price-to-earnings ratio of 7.8x it looks markedly cheaper than both peers and the wider industry.
The price-to-earnings multiple compares today’s share price with the company’s earnings per share, making it a direct snapshot of how the market values current profits. For a diversified copper and gold producer that has recently swung into strong profitability, this lens is particularly useful because it translates the earnings turnaround into a clear valuation signal.
Imperial’s earnings grew by 455.7% over the past year and its net profit margins have expanded sharply, yet the stock trades at 7.8x earnings while peers average 32x and the broader Canadian Metals and Mining industry sits near 21.1x. That combination of rapid earnings growth, improved margins and a discount multiple suggests the market is still pricing Imperial’s profits well below the sector, even as its one year total return has outpaced both the industry and the Canadian market.
Compared to the Canadian Metals and Mining industry average price-to-earnings ratio of 21.1x and a peer average of 32x, Imperial’s 7.8x stands out as a deep discount rather than a modest gap, indicating investors are paying far less for each dollar of Imperial’s earnings than they are for comparable miners.
See what the numbers say about this price — find out in our valuation breakdown.
Result: Price-to-Earnings of 7.8x (UNDERVALUED)
However, investors should still weigh commodity price volatility and potential operational setbacks, either of which could quickly compress margins and challenge today’s valuation case.
Find out about the key risks to this Imperial Metals narrative.
Another Angle on Value
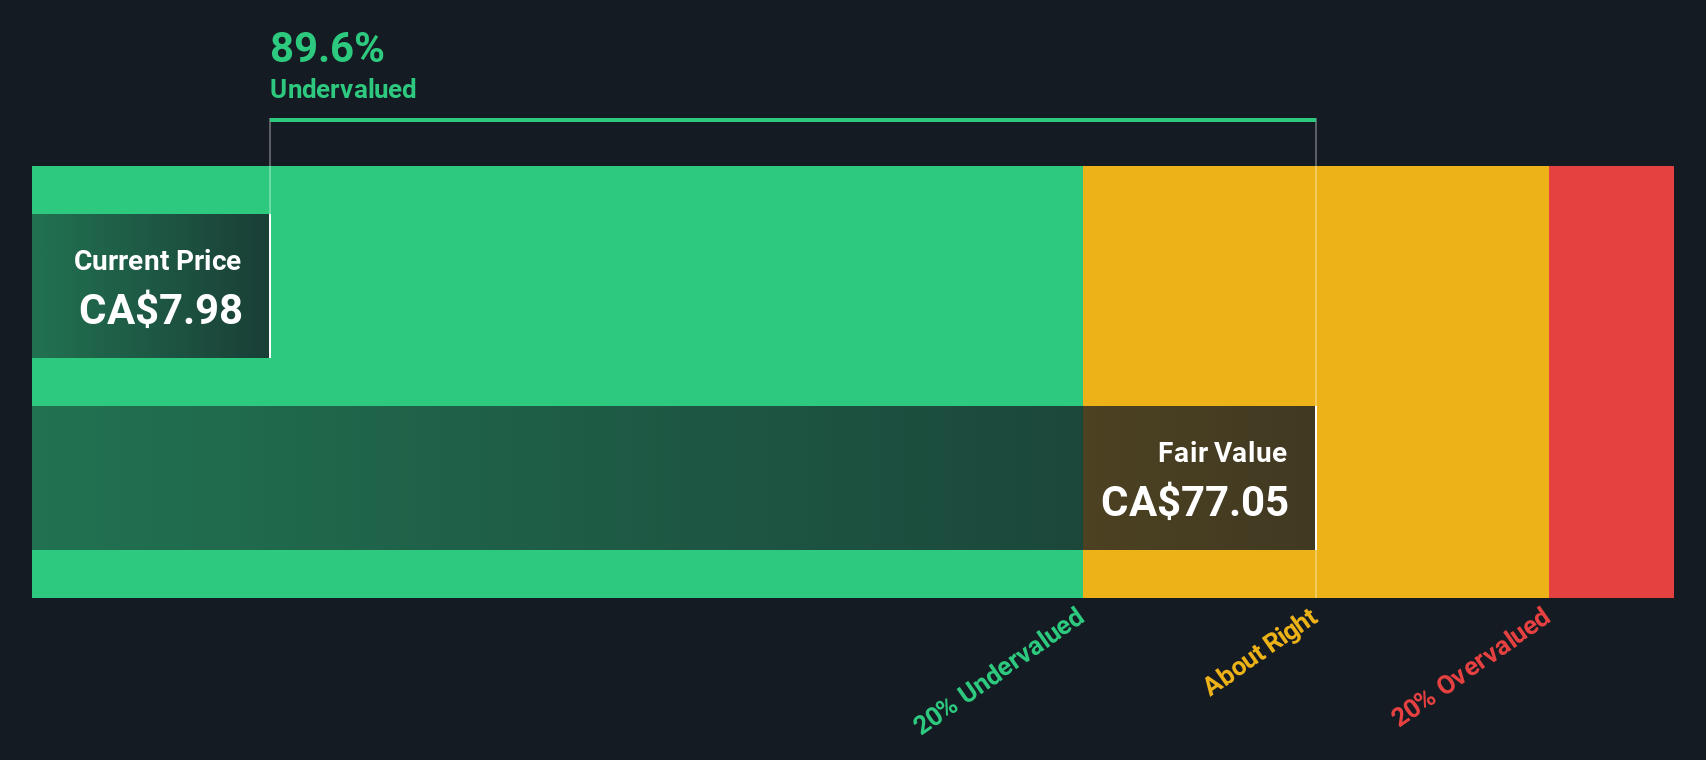
Our DCF model paints an even more extreme picture, suggesting Imperial Metals is trading at a steep discount to an estimated fair value of CA$77.05. If the cash flow assumptions hold, that gap could signal significant upside. The key question is whether the market is seeing risk that the model cannot.
Look into how the SWS DCF model arrives at its fair value.
Simply Wall St performs a discounted cash flow (DCF) on every stock in the world every day (check out Imperial Metals for example). We show the entire calculation in full. You can track the result in your watchlist or portfolio and be alerted when this changes, or use our stock screener to discover 900 undervalued stocks based on their cash flows. If you save a screener we even alert you when new companies match - so you never miss a potential opportunity.
Build Your Own Imperial Metals Narrative
If this perspective does not fully align with your own or you want to dig into the numbers yourself, you can build a custom view in minutes, Do it your way.
A good starting point is our analysis highlighting 2 key rewards investors are optimistic about regarding Imperial Metals.
Looking for more investment ideas?
Before you move on, lock in a few fresh leads from the Simply Wall St Screener so you are not relying on just one winning theme.
- Target income focused opportunities with reliable payouts by reviewing these 15 dividend stocks with yields > 3% that can help stabilise your portfolio while other positions swing.
- Tap into breakthrough innovation by scanning these 27 quantum computing stocks that could reshape computing, security, and data processing over the coming decade.
- Position yourself early in structural shifts by assessing these 80 cryptocurrency and blockchain stocks riding the momentum behind digital assets and blockchain adoption.
This article by Simply Wall St is general in nature. We provide commentary based on historical data and analyst forecasts only using an unbiased methodology and our articles are not intended to be financial advice. It does not constitute a recommendation to buy or sell any stock, and does not take account of your objectives, or your financial situation. We aim to bring you long-term focused analysis driven by fundamental data. Note that our analysis may not factor in the latest price-sensitive company announcements or qualitative material. Simply Wall St has no position in any stocks mentioned.
Have feedback on this article? Concerned about the content? Get in touch with us directly. Alternatively, email editorial-team@simplywallst.com