
Does The Market Underappreciate Hologic As Cash Flow Value Contrasts With Flat Long Term Returns
- Wondering if Hologic is quietly becoming good value, or if the market is still sleeping on it? This breakdown will walk you through what the numbers are really saying about the stock.
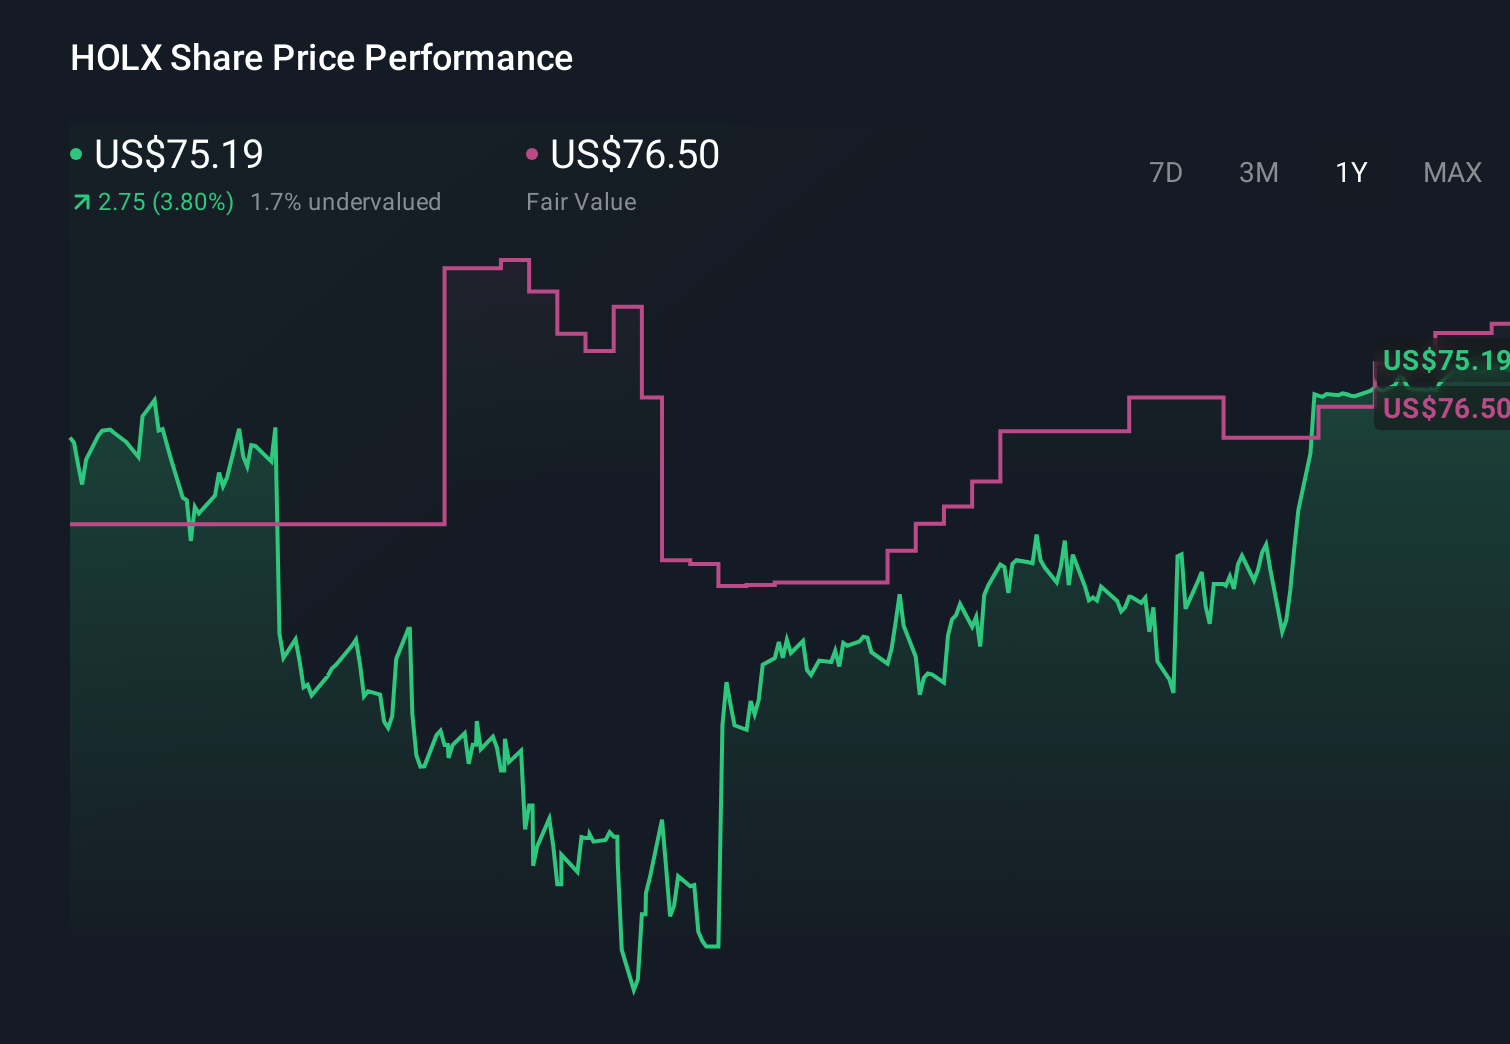
- The share price has been relatively steady, with a 0.8% gain over the last month and a 4.4% rise year to date, but returns over 1, 3 and 5 years are roughly flat, suggesting sentiment is cautious rather than euphoric.
- Recently, Hologic has stayed in the spotlight as a key player in women’s health, continuing to expand its presence in diagnostics and medical imaging through ongoing product enhancements and strategic partnerships. Broader attention on healthcare innovation and screening technologies has also helped keep investor interest alive, even if the share price has not broken out decisively yet.
- On our checks, Hologic scores a 3/6 valuation score, meaning it looks undervalued on half of the key metrics we track. Below, we will unpack this using multiple valuation approaches and, later on, a more holistic way to judge whether the stock truly fits your strategy.
Find out why Hologic's -0.8% return over the last year is lagging behind its peers.
Approach 1: Hologic Discounted Cash Flow (DCF) Analysis
A Discounted Cash Flow model estimates what a company is worth by projecting its future cash flows and discounting them back to today in dollar terms. For Hologic, the model used is a 2 Stage Free Cash Flow to Equity approach, which starts from the latest twelve month free cash flow of about $905.8 million and then builds in growth before tapering to more modest long term assumptions.
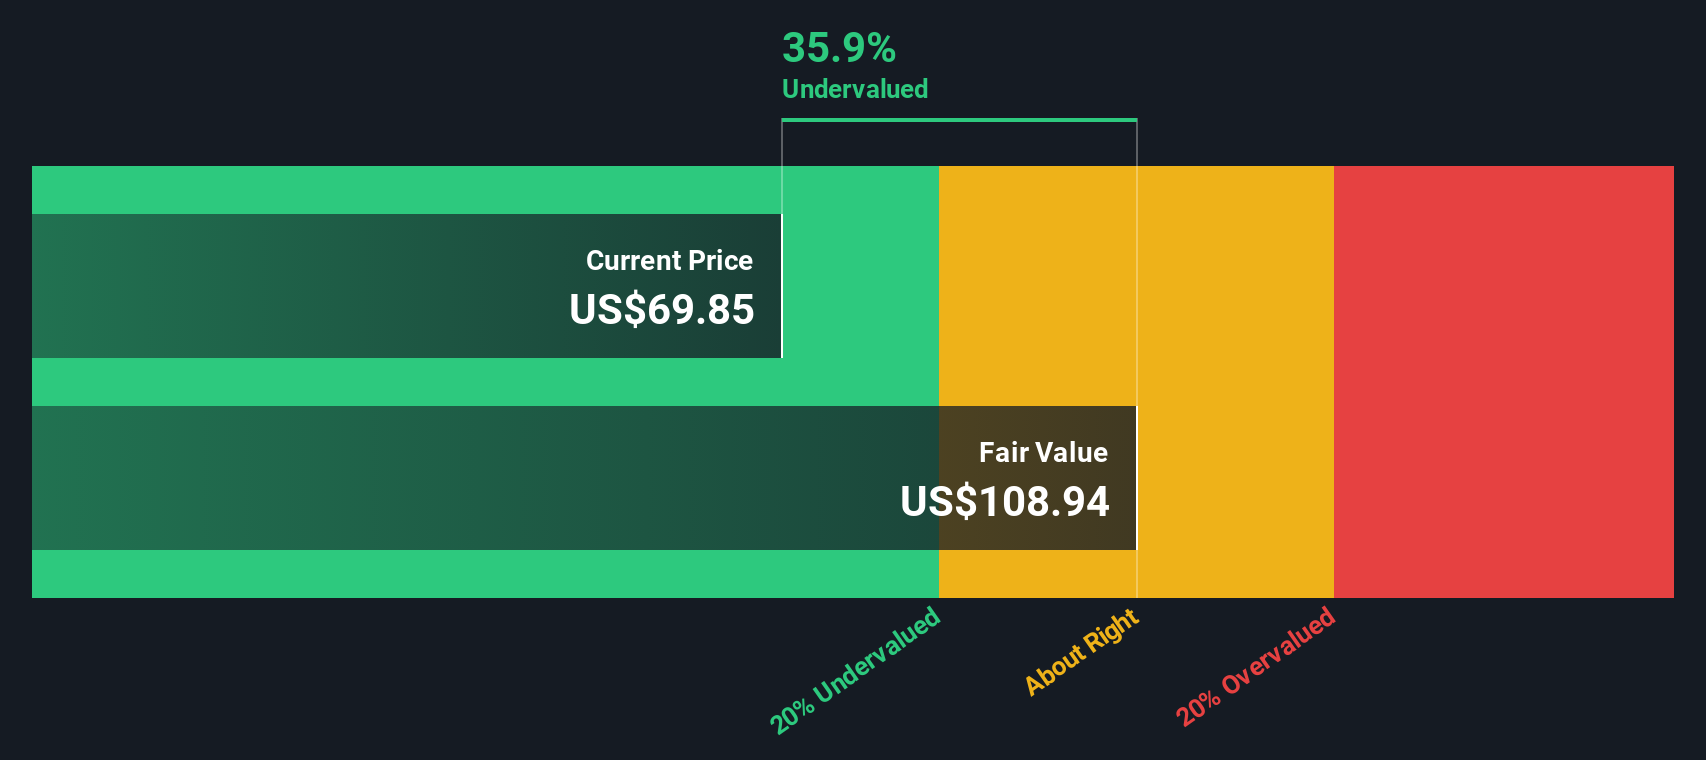
Analysts see free cash flow rising to around $1.16 billion by 2028, and Simply Wall St extrapolates this further, with projections stepping up through the early 2030s. These projected cash flows are then discounted back to today to arrive at an estimated intrinsic value of roughly $105.33 per share.
Relative to the current market price, this implies Hologic trades at about a 28.9% discount, based on this particular set of assumptions about its future cash generation.
Result: UNDERVALUED
Our Discounted Cash Flow (DCF) analysis suggests Hologic is undervalued by 28.9%. Track this in your watchlist or portfolio, or discover 899 more undervalued stocks based on cash flows.
Approach 2: Hologic Price vs Earnings
For profitable, established companies like Hologic, the Price to Earnings ratio is a useful way to gauge how much investors are willing to pay today for each dollar of current earnings. A higher PE ratio is usually justified when the market expects stronger growth and sees lower risk, while slower growth or higher uncertainty typically warrants a lower, more conservative multiple.
Hologic currently trades on a PE of about 29.5x, which is roughly in line with the broader Medical Equipment industry average of 29.5x, but well below the peer group average of around 40.9x. Simply Wall St also calculates a proprietary Fair Ratio of 28.1x for Hologic, which reflects what the PE should be once factors like earnings growth, profitability, industry, company size and risk profile are all taken into account.
This Fair Ratio is more tailored than a simple industry or peer comparison, because it adjusts for the specific characteristics of Hologic rather than assuming all medical equipment stocks deserve the same multiple. With the current PE of 29.5x sitting slightly above the Fair Ratio of 28.1x, the shares look modestly expensive on this metric.
Result: OVERVALUED

PE ratios tell one story, but what if the real opportunity lies elsewhere? Discover 1450 companies where insiders are betting big on explosive growth.
Upgrade Your Decision Making: Choose your Hologic Narrative
Earlier we mentioned that there is an even better way to understand valuation. Let us introduce you to Narratives, a simple tool on Simply Wall St’s Community page that lets you attach a clear story to your numbers by linking your view of Hologic’s future revenue, earnings and margins to a financial forecast, a fair value estimate and a concrete buy or sell decision. That fair value is compared against today’s price and then updated dynamically when new news or earnings arrive. For example, one investor might build a bullish Hologic Narrative around innovation, international expansion and margin gains to justify a fair value near the top of the current analyst range around $94 per share. Another might focus on China headwinds, tariff pressure and slower end markets to anchor a more cautious Narrative closer to the low end near $65. Each Narrative turns those assumptions into a living, trackable fair value that helps investors decide whether the current price looks attractive, fairly valued or stretched.
Do you think there's more to the story for Hologic? Head over to our Community to see what others are saying!
This article by Simply Wall St is general in nature. We provide commentary based on historical data and analyst forecasts only using an unbiased methodology and our articles are not intended to be financial advice. It does not constitute a recommendation to buy or sell any stock, and does not take account of your objectives, or your financial situation. We aim to bring you long-term focused analysis driven by fundamental data. Note that our analysis may not factor in the latest price-sensitive company announcements or qualitative material. Simply Wall St has no position in any stocks mentioned.
Have feedback on this article? Concerned about the content? Get in touch with us directly. Alternatively, email editorial-team@simplywallst.com