
Is It Too Late to Consider American Eagle After Its Recent 40% Share Price Surge?
- Wondering if American Eagle Outfitters is still good value after its latest run, or if you are late to the party? This breakdown will walk through what the numbers are really saying about the stock.
- The share price has climbed to around $23.91, with gains of 14.8% over the last week, 39.8% over the past month, and more than 40% over the last year. This naturally raises questions about how much upside is left versus the risk of a pullback.
- Recent moves have been supported by stronger sentiment around U.S. consumer spending and renewed interest in specialty retailers, as investors look for brands with resilient customer bases and improving store productivity. At the same time, shifting expectations around interest rates and the wider retail environment have added a layer of volatility that makes valuation more important than ever.
- On our framework, American Eagle Outfitters currently scores a 1 out of 6 valuation score, which suggests it looks undervalued on only one of our six standard checks. In the sections that follow, we will unpack what that actually means across different valuation approaches, and then circle back at the end with a more powerful way to think about what the market is really pricing in.
American Eagle Outfitters scores just 1/6 on our valuation checks. See what other red flags we found in the full valuation breakdown.
Approach 1: American Eagle Outfitters Discounted Cash Flow (DCF) Analysis
A Discounted Cash Flow model estimates what a company is worth by projecting the cash it can generate in the future and then discounting those cash flows back into today’s dollars.
For American Eagle Outfitters, the latest twelve month Free Cash Flow is about $190 million. Analysts expect cash flows to grow steadily, with projections of around $217.5 million by 2026 and roughly $335 million by 2035, although estimates beyond the next few years are extrapolated from available forecasts rather than based on detailed analyst models.
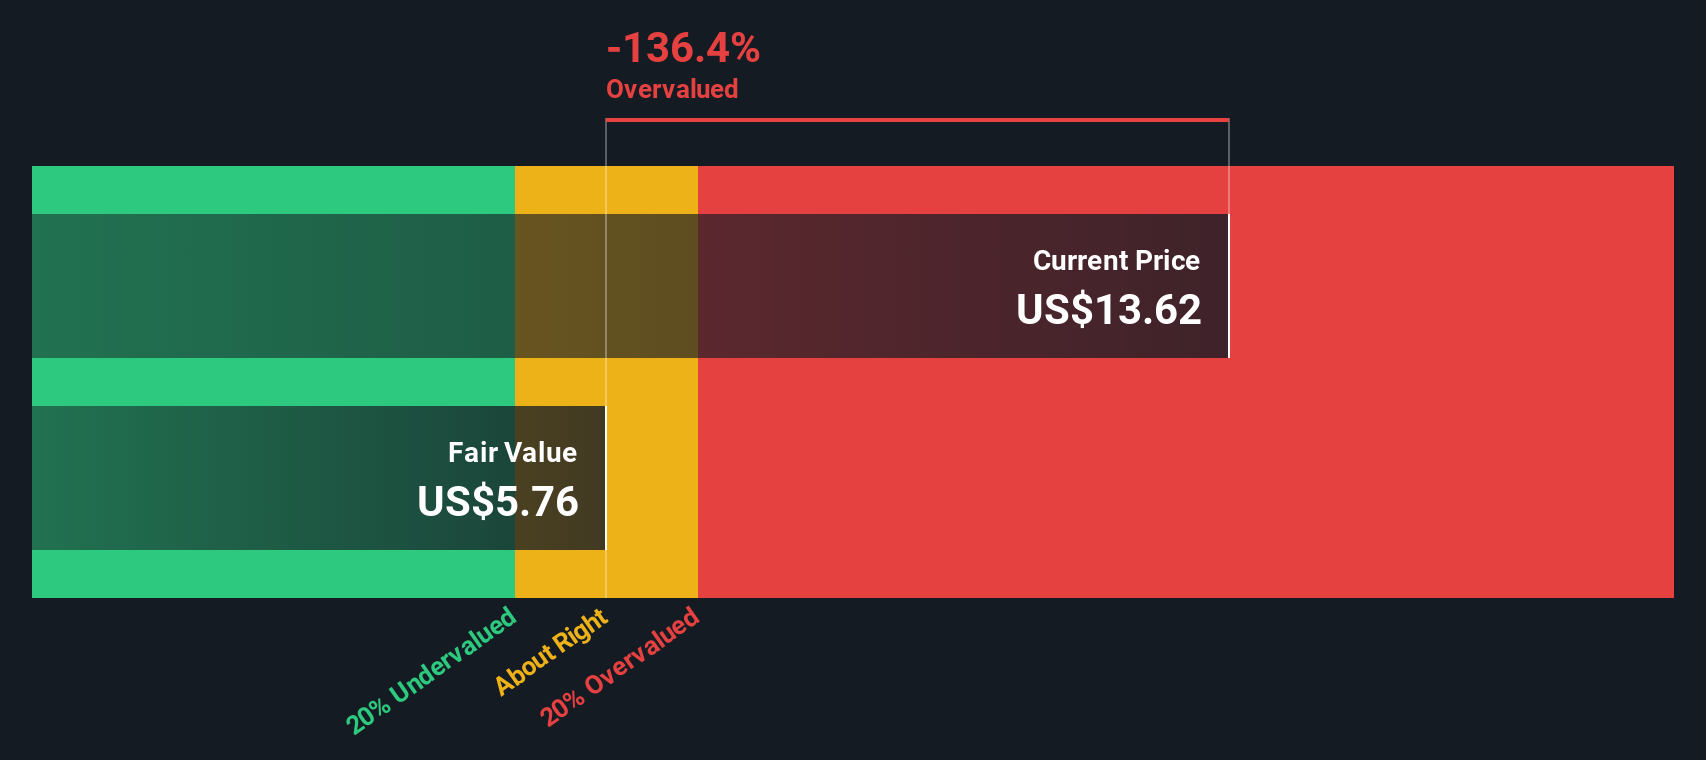
Using a 2 Stage Free Cash Flow to Equity approach, these future cash flows are discounted back to arrive at an intrinsic value of roughly $21.61 per share. Compared with the current share price of about $23.91, the model suggests the stock is roughly 10.7% overvalued. This indicates that some optimism may already be reflected in the price and that the margin of safety could be limited at today’s levels.
Result: OVERVALUED
Our Discounted Cash Flow (DCF) analysis suggests American Eagle Outfitters may be overvalued by 10.7%. Discover 899 undervalued stocks or create your own screener to find better value opportunities.
Approach 2: American Eagle Outfitters Price vs Earnings
For a profitable retailer like American Eagle Outfitters, the price to earnings ratio is a useful way to judge value because it links what you pay today directly to the earnings the business is already producing. In simple terms, the higher the expected growth and the lower the perceived risk, the more investors are usually willing to pay in the form of a higher PE multiple.
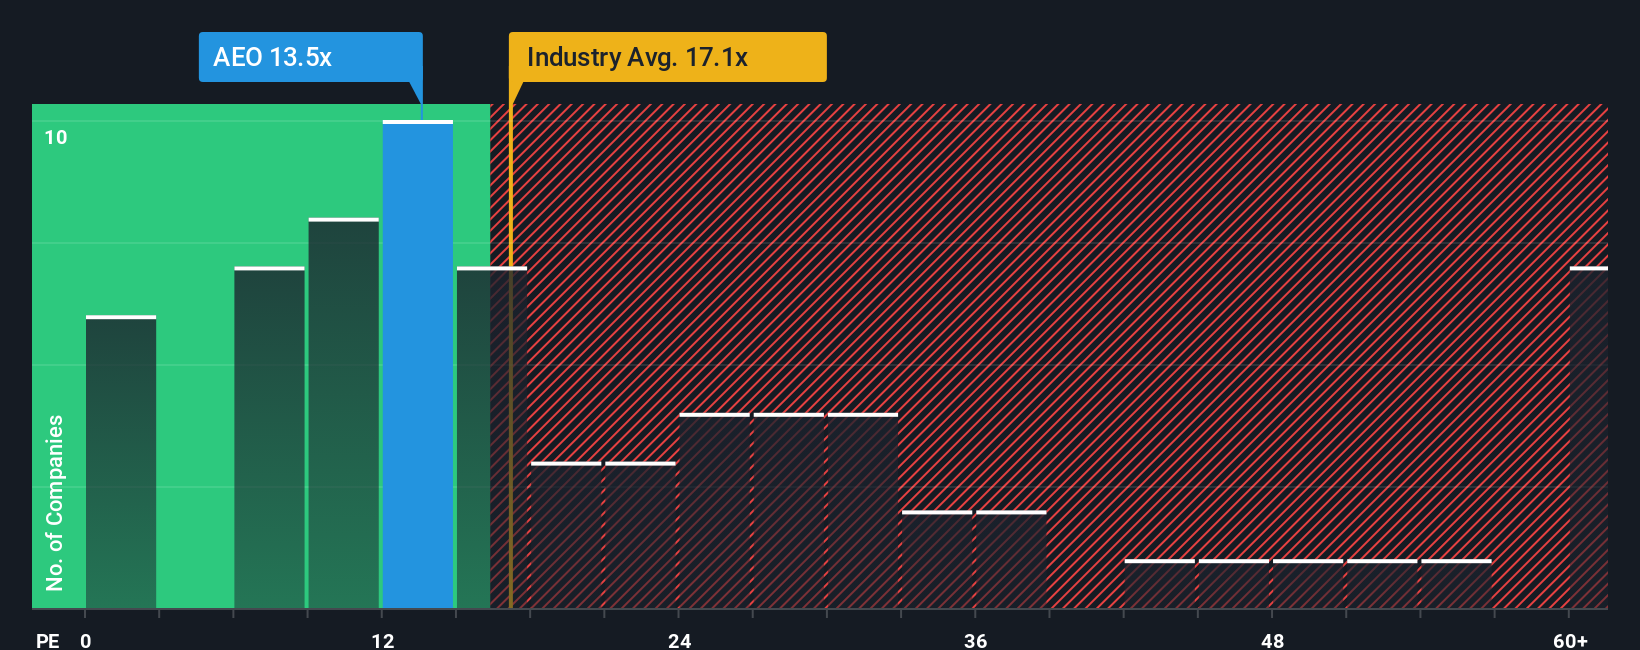
American Eagle Outfitters currently trades on a PE of about 19.4x. That is very close to both the Specialty Retail industry average of around 19.4x and the broader peer group, which also sits near 19.2x. On the surface, the market is valuing American Eagle much like a typical retailer in its space, without a big premium or discount relative to its closest comparables.
Simply Wall St’s Fair Ratio framework goes a step further by estimating what PE multiple would make sense given American Eagle’s specific earnings growth outlook, profitability, size and risk profile. This tailored view suggests a Fair Ratio of roughly 25.6x, which is meaningfully higher than the current 19.4x. On that basis, the shares appear undervalued compared with what investors might reasonably pay for the company’s fundamentals.
Result: UNDERVALUED
PE ratios tell one story, but what if the real opportunity lies elsewhere? Discover 1450 companies where insiders are betting big on explosive growth.
Upgrade Your Decision Making: Choose your American Eagle Outfitters Narrative
Earlier we mentioned that there is an even better way to understand valuation, so let us introduce you to Narratives, a simple tool on Simply Wall St’s Community page that lets you connect the story you believe about American Eagle Outfitters with your own assumptions for future revenue, earnings, margins and a resulting fair value. You can then compare that Fair Value to today’s Price to help decide when to buy or sell. The tool automatically updates as new information like earnings, news or guidance comes in. One investor might build a bullish Narrative around marketing momentum, digital investments and margin gains that supports a Fair Value closer to the high analyst target of about $21.50. Another might focus on tariff risks, softer consumer demand and markdown pressure that anchors a more cautious Narrative nearer the low target of roughly $10. Both perspectives are translated into numbers the moment they are created.
Do you think there's more to the story for American Eagle Outfitters? Head over to our Community to see what others are saying!

This article by Simply Wall St is general in nature. We provide commentary based on historical data and analyst forecasts only using an unbiased methodology and our articles are not intended to be financial advice. It does not constitute a recommendation to buy or sell any stock, and does not take account of your objectives, or your financial situation. We aim to bring you long-term focused analysis driven by fundamental data. Note that our analysis may not factor in the latest price-sensitive company announcements or qualitative material. Simply Wall St has no position in any stocks mentioned.
Have feedback on this article? Concerned about the content? Get in touch with us directly. Alternatively, email editorial-team@simplywallst.com