
Has the 2025 Rally in General Dynamics Already Gone Too Far?
- Wondering if General Dynamics is still worth buying after its big run, or if the best days are already priced in? You are not alone. That is exactly what we are going to unpack here.
- Even after a strong multi year climb with the stock up 28.5% over the past year and 143.7% over five years, recent momentum has cooled a bit, with a 1.1% dip over the last week and a 4.4% slide in the past month. Year to date it is still up 28.1%.
- Recent moves in General Dynamics have been shaped by ongoing defense spending tailwinds, large contract wins across its aerospace and defense segments, and shifting expectations around long term geopolitical risk. Together, these factors have kept sentiment constructive while also making investors more sensitive to how much future growth is already embedded in the share price.
- Right now, General Dynamics scores a 4 out of 6 on our valuation checks, suggesting it looks undervalued on several key metrics but not all of them. Next we will break down those different valuation approaches before finishing with a more powerful way to think about what the stock is truly worth.
Find out why General Dynamics's 28.5% return over the last year is lagging behind its peers.
Approach 1: General Dynamics Discounted Cash Flow (DCF) Analysis
A Discounted Cash Flow model estimates what a company is worth by projecting the cash it can generate in the future and then discounting those cash flows back to todays value.
For General Dynamics, the model starts with last twelve month free cash flow of about $4.6 billion and uses analyst forecasts for the next few years before extrapolating longer term trends. Analyst and model projections see free cash flow rising toward roughly $6.0 billion by 2035, reflecting steady but not explosive growth in the underlying business.
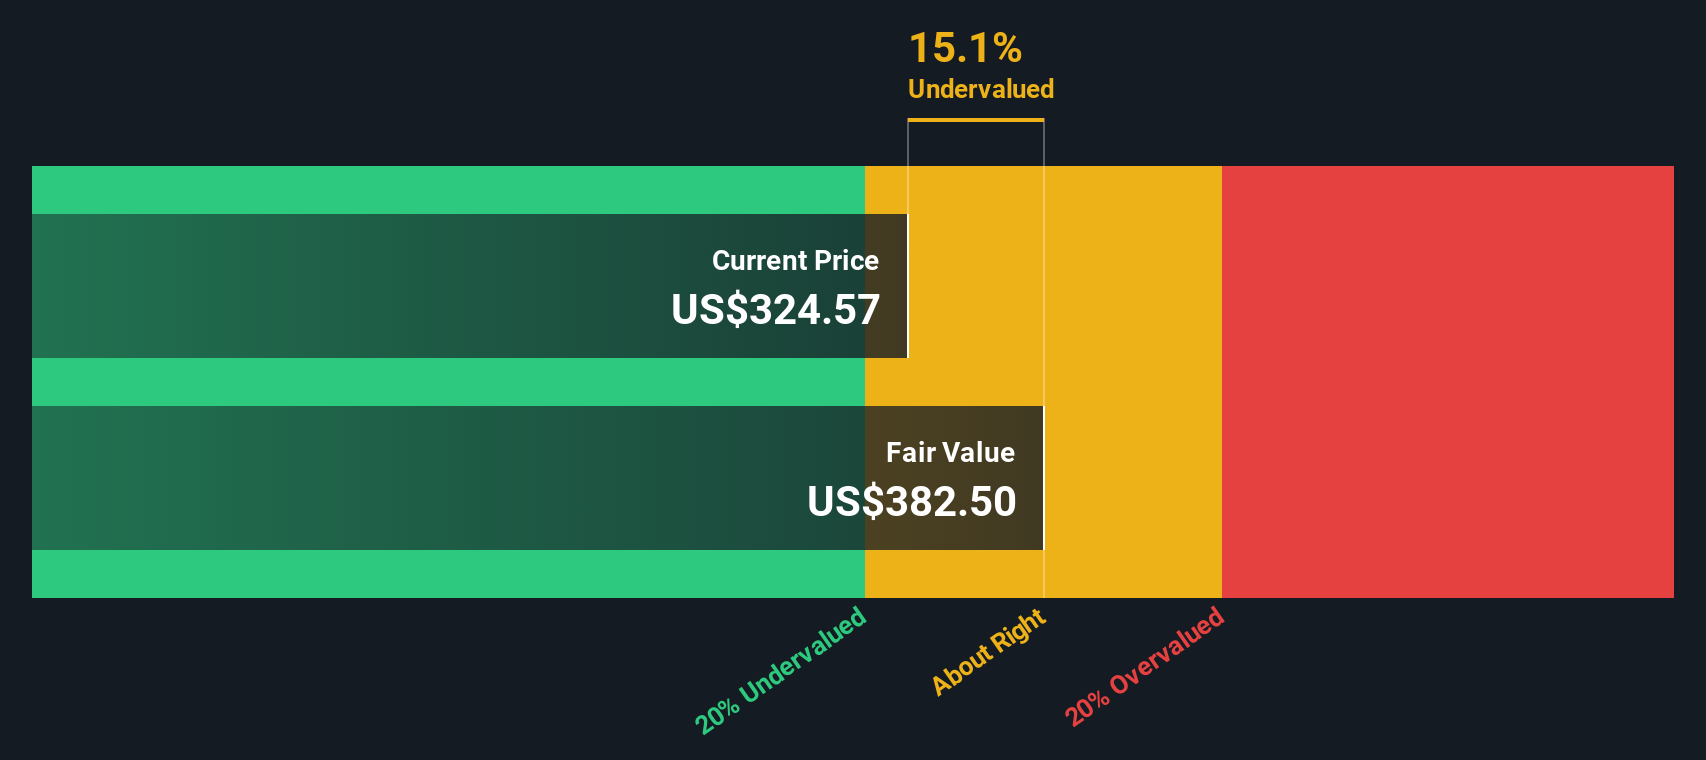
Aggregating and discounting these cash flows using a 2 Stage Free Cash Flow to Equity approach results in an estimated intrinsic value of about $372.41 per share. Compared with the current market price, this implies the shares trade at a 10.2% discount. This suggests investors are not fully pricing in the projected cash generation from the companys contracts and backlog.
On this DCF view, General Dynamics appears modestly undervalued rather than aggressively cheap. However, it still offers a reasonable margin of safety for long term holders.
Result: UNDERVALUED
Our Discounted Cash Flow (DCF) analysis suggests General Dynamics is undervalued by 10.2%. Track this in your watchlist or portfolio, or discover 899 more undervalued stocks based on cash flows.
Approach 2: General Dynamics Price vs Earnings
For profitable, established businesses like General Dynamics, the price to earnings ratio is often the most intuitive way to think about valuation because it directly links what investors pay today with the profits the company is generating.
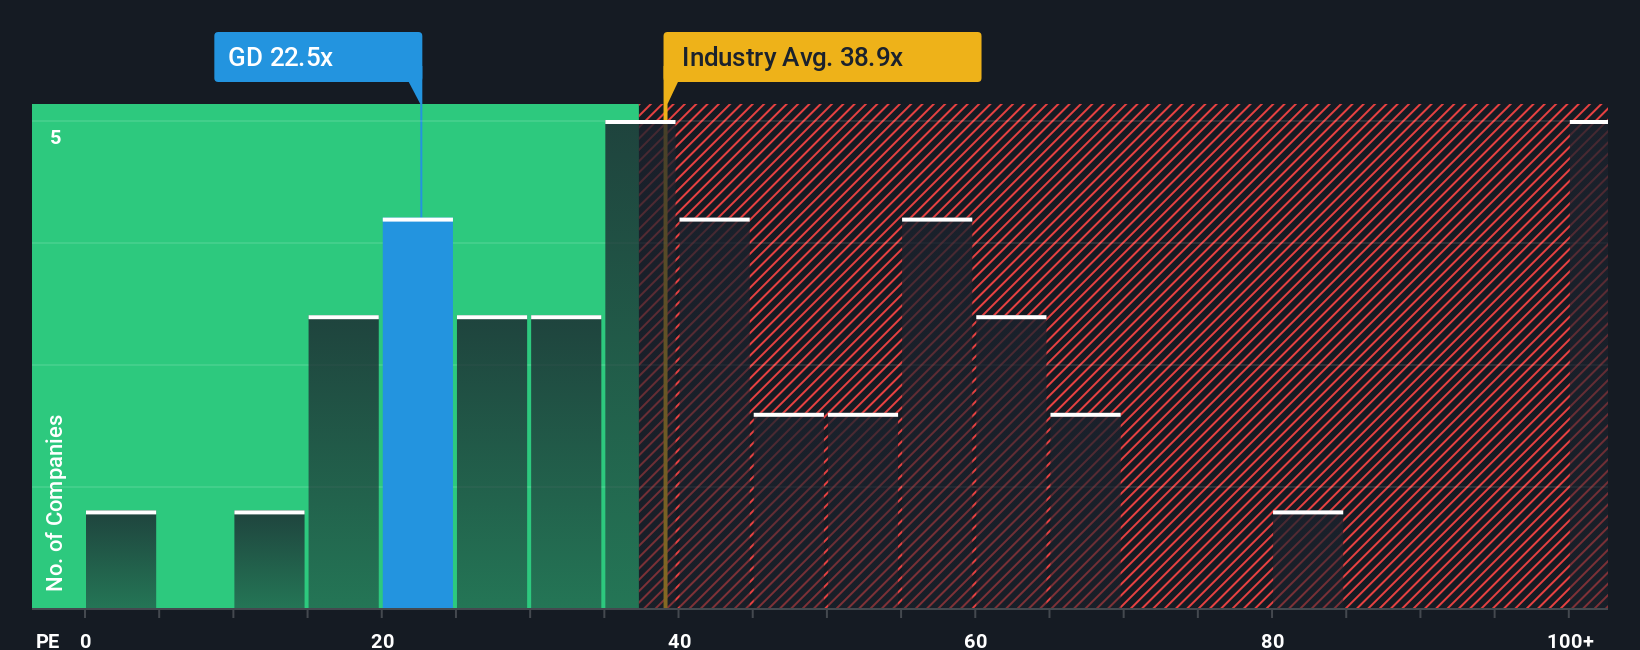
In general, companies with faster, more reliable earnings growth and lower perceived risk are often associated with a higher, or premium, PE ratio, while slower growing or riskier companies tend to trade on lower multiples. General Dynamics currently trades around 21.4x earnings. This is meaningfully below both the Aerospace and Defense industry average of about 36.2x and the peer group average of roughly 34.5x. This suggests the market is assigning it a discount relative to those comparators despite its solid fundamentals.
Simply Wall Sts Fair Ratio metric estimates what a more appropriate PE would be once earnings growth, profit margins, industry, market cap and company specific risks are all factored in. For General Dynamics, that Fair Ratio is about 27.4x, which indicates the stock arguably trades on a lower multiple than this metric implies. Because this Fair Ratio is materially above the actual PE, the multiple based view is consistent with the DCF and points to the shares being valued below that framework rather than fully priced.
Result: UNDERVALUED
PE ratios tell one story, but what if the real opportunity lies elsewhere? Discover 1450 companies where insiders are betting big on explosive growth.
Upgrade Your Decision Making: Choose your General Dynamics Narrative
Earlier we mentioned that there is an even better way to understand valuation, so let us introduce you to Narratives, a simple way to connect your view of the General Dynamics story with a concrete forecast for revenue, earnings and margins, and then a Fair Value you can compare to today’s price.
On Simply Wall St’s Community page, Narratives let you turn your perspective into numbers by outlining what you think will drive the business, mapping that into a financial forecast, and automatically translating it into a Fair Value that updates dynamically as new earnings, contracts, or news headlines arrive.
This can help make decisions more intuitive, because you can see at a glance whether your Fair Value sits above or below the current market price, and how that gap changes as conditions evolve rather than relying only on static ratios like PE.
For example, one investor might build a bullish General Dynamics Narrative around record backlogs and higher margins that supports a Fair Value closer to the high analyst range near 400 dollars. In contrast, a more cautious investor could focus on execution and budget risks and land nearer the low 280 dollar bear case, with both views living side by side and updating as new information comes in.
Do you think there's more to the story for General Dynamics? Head over to our Community to see what others are saying!
This article by Simply Wall St is general in nature. We provide commentary based on historical data and analyst forecasts only using an unbiased methodology and our articles are not intended to be financial advice. It does not constitute a recommendation to buy or sell any stock, and does not take account of your objectives, or your financial situation. We aim to bring you long-term focused analysis driven by fundamental data. Note that our analysis may not factor in the latest price-sensitive company announcements or qualitative material. Simply Wall St has no position in any stocks mentioned.
Have feedback on this article? Concerned about the content? Get in touch with us directly. Alternatively, email editorial-team@simplywallst.com