
How Should Investors View Duke Energy After Its Recent Share Price Pullback in 2025?
- If you are wondering whether Duke Energy is still a solid value play after its long run as a defensive utility stock, or if you would be overpaying at today’s price, you are not alone.
- The stock has dipped about 3.7% over the last week and 6.8% over the last month, but it is still up 6.9% year to date and roughly 52.2% over five years, which suggests steady long term compounding rather than a fleeting spike.
- Recent moves have come as investors reassess regulated utilities in light of shifting interest rate expectations and ongoing investment in grid modernization and cleaner generation. These themes directly impact how markets value Duke’s future cash flows. At the same time, policy support for infrastructure and renewables has kept long horizon demand for Duke’s assets in focus, even as short term sentiment wobbles.
- On our framework, Duke Energy scores a 3 out of 6 valuation checks, suggesting the stock is neither a clear bargain nor obviously overpriced. This makes it worth digging into how different valuation methods see it, and then looking at an even sharper way of thinking about value that we will come to at the end of this article.
Find out why Duke Energy's 7.5% return over the last year is lagging behind its peers.
Approach 1: Duke Energy Dividend Discount Model (DDM) Analysis
The Dividend Discount Model estimates what a stock is worth by projecting all future dividends per share, assuming a long run growth rate, and discounting those payments back to today.
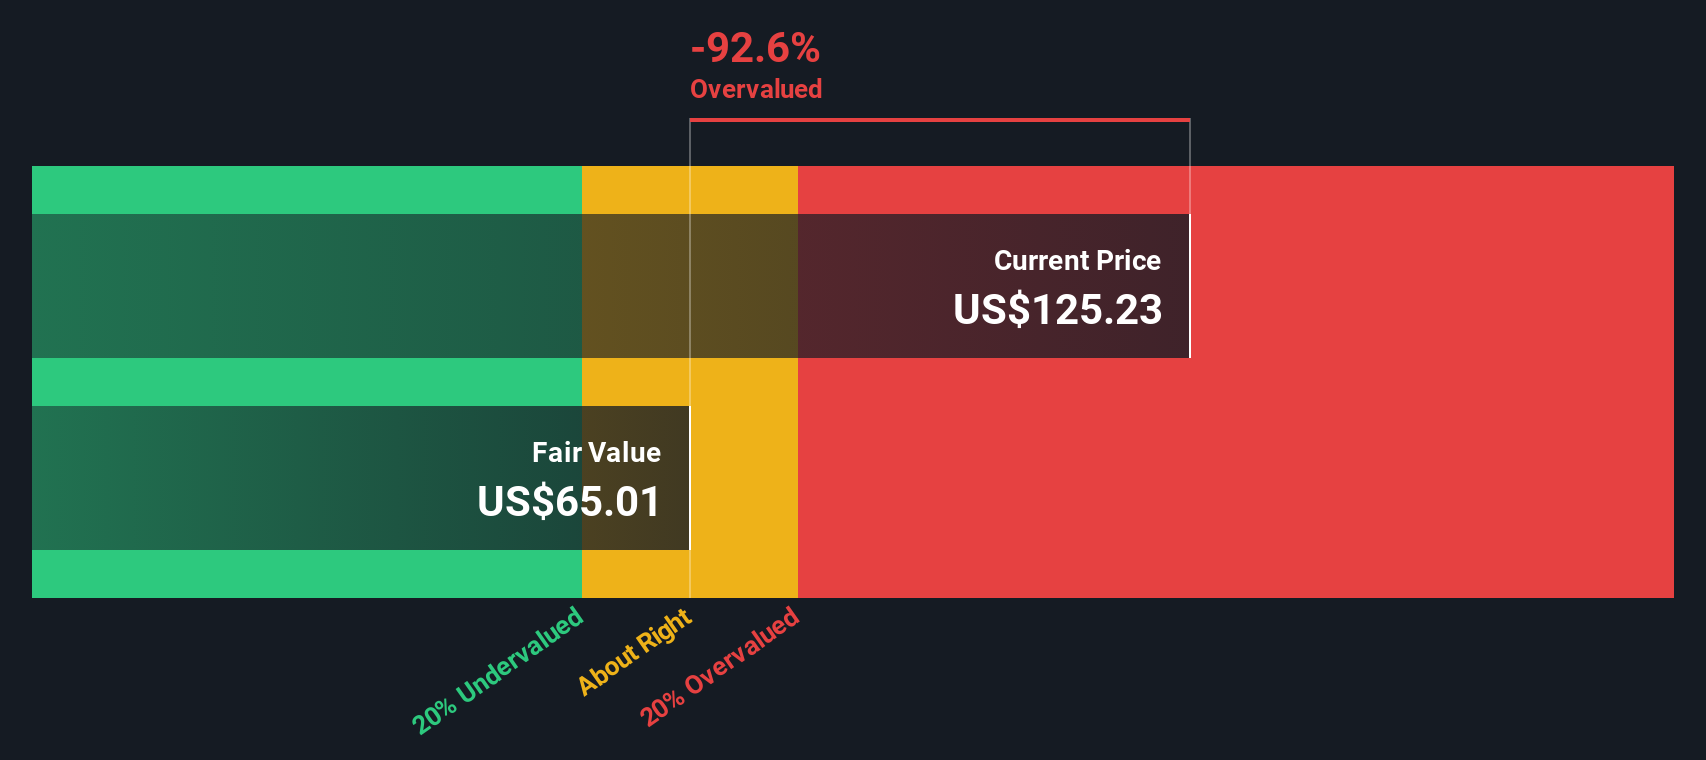
For Duke Energy, the model starts with an annual dividend per share of about $4.50, alongside a return on equity of roughly 8.8%. However, the payout ratio is very high at around 102%, which means Duke is paying out essentially all of its earnings and then some in dividends rather than retaining profits to grow. This leads the model to infer a slightly negative long term dividend growth rate of roughly 0.2% a year, based on the formula given in the data.
When these assumptions are run through the DDM, the estimated intrinsic value comes out at about $63.17 per share. Compared with the current share price, this suggests the stock is roughly 82.4% overvalued on this framework, indicating that investors may be paying a rich premium for Duke’s dividend stream.
Result: OVERVALUED
Our Dividend Discount Model (DDM) analysis suggests Duke Energy may be overvalued by 82.4%. Discover 899 undervalued stocks or create your own screener to find better value opportunities.
Approach 2: Duke Energy Price vs Earnings
For a profitable, mature business like Duke Energy, the price to earnings (PE) ratio is a useful way to gauge what investors are willing to pay for each dollar of current earnings. In broad terms, companies with stronger growth prospects and lower perceived risk can justify higher PE ratios, while slower growing or riskier names usually trade on lower multiples.
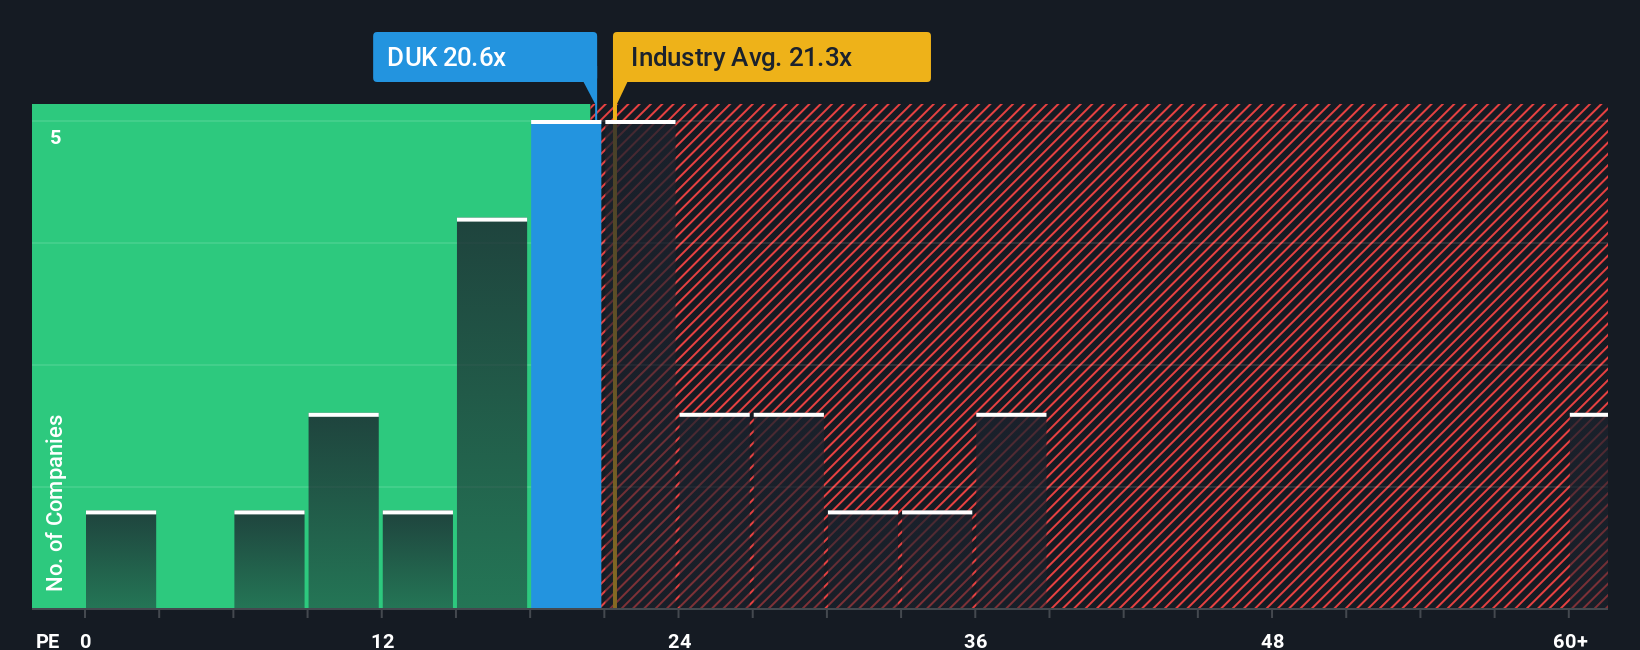
Duke currently trades on a PE of about 18.2x, which is slightly below the Electric Utilities industry average of roughly 19.9x and well below the peer group average of around 26.1x. At first glance, that discount versus peers might make the stock look appealing, but simple comparisons like these do not fully reflect Duke’s specific growth profile, profitability, size and risk.
This is where Simply Wall St’s Fair Ratio comes in. It estimates what a reasonable PE would be for Duke given its earnings growth, margins, industry, market cap and risk factors, and comes out at about 24.2x. Because this is meaningfully higher than the current 18.2x, the preferred multiple framework suggests that, relative to its fundamentals, Duke Energy appears undervalued on earnings.
Result: UNDERVALUED
PE ratios tell one story, but what if the real opportunity lies elsewhere? Discover 1450 companies where insiders are betting big on explosive growth.
Upgrade Your Decision Making: Choose your Duke Energy Narrative
Earlier we mentioned that there is an even better way to understand valuation, so let us introduce Narratives, a simple way to connect your view of Duke Energy’s business to a concrete forecast and fair value by telling the story behind your numbers for future revenue, earnings and margins. A Narrative links what you believe will happen, such as ongoing Southeast growth, grid modernization and supportive regulation, to a financial model and then to a fair value. It lives on Simply Wall St’s Community page where millions of investors can easily build, compare and refine their ideas. Narratives can help inform decisions by continuously comparing your Fair Value to today’s share price, and they automatically update as new news, earnings and regulatory developments come in. For example, one Duke Energy Narrative might assume robust demand growth, rising profit margins and a fair value near the recent high consensus of about $137 per share. A more cautious Narrative could emphasize regulatory or decarbonization risks, weaker margins and a fair value well below that, providing a clear, dynamic framework for organizing your analysis.
Do you think there's more to the story for Duke Energy? Head over to our Community to see what others are saying!

This article by Simply Wall St is general in nature. We provide commentary based on historical data and analyst forecasts only using an unbiased methodology and our articles are not intended to be financial advice. It does not constitute a recommendation to buy or sell any stock, and does not take account of your objectives, or your financial situation. We aim to bring you long-term focused analysis driven by fundamental data. Note that our analysis may not factor in the latest price-sensitive company announcements or qualitative material. Simply Wall St has no position in any stocks mentioned.
Have feedback on this article? Concerned about the content? Get in touch with us directly. Alternatively, email editorial-team@simplywallst.com