
Has Eaton’s Pullback After Grid Modernization Wins Created an Opportunity in 2025?
- If you are wondering whether Eaton is still a smart buy after its long run up, or if the real value has already been priced in, this article will walk you through what the numbers are actually saying about the stock today.
- Eaton’s share price has pulled back about 10.0% over the last month after a strong multi year climb. It is still up 3.0% year to date and more than 220% over five years, which hints that investors are reassessing how much future growth is worth paying for.
- Recent headlines have focused on Eaton’s expanding role in electrification and grid modernization, including major contract wins and growing demand for its electrical components. These factors help explain why the stock has been such a long term winner. At the same time, commentary around infrastructure spending, energy transition policies, and higher for longer interest rates has added some caution to the narrative and likely contributed to the recent pullback.
- Right now Eaton only scores a 2 out of 6 on our valuation checks, suggesting the market may be asking a full price in several areas. Next we will break down what different valuation approaches say about that price tag, and then finish with a more intuitive way to think about Eaton’s true long term value.
Eaton scores just 2/6 on our valuation checks. See what other red flags we found in the full valuation breakdown.
Approach 1: Eaton Discounted Cash Flow (DCF) Analysis
A Discounted Cash Flow model estimates what a business is worth today by projecting the cash it can generate in the future and discounting those cash flows back to the present.
For Eaton, the latest twelve month Free Cash Flow is about $3.3 billion. Analyst forecasts and Simply Wall St extrapolations indicate Free Cash Flow could reach roughly $4.4 billion by 2026 and around $4.9 billion by 2035 in this model, with these figures reflecting the assumptions used in the valuation. All of these cash flows are modeled in $ and then discounted using a 2 Stage Free Cash Flow to Equity approach.
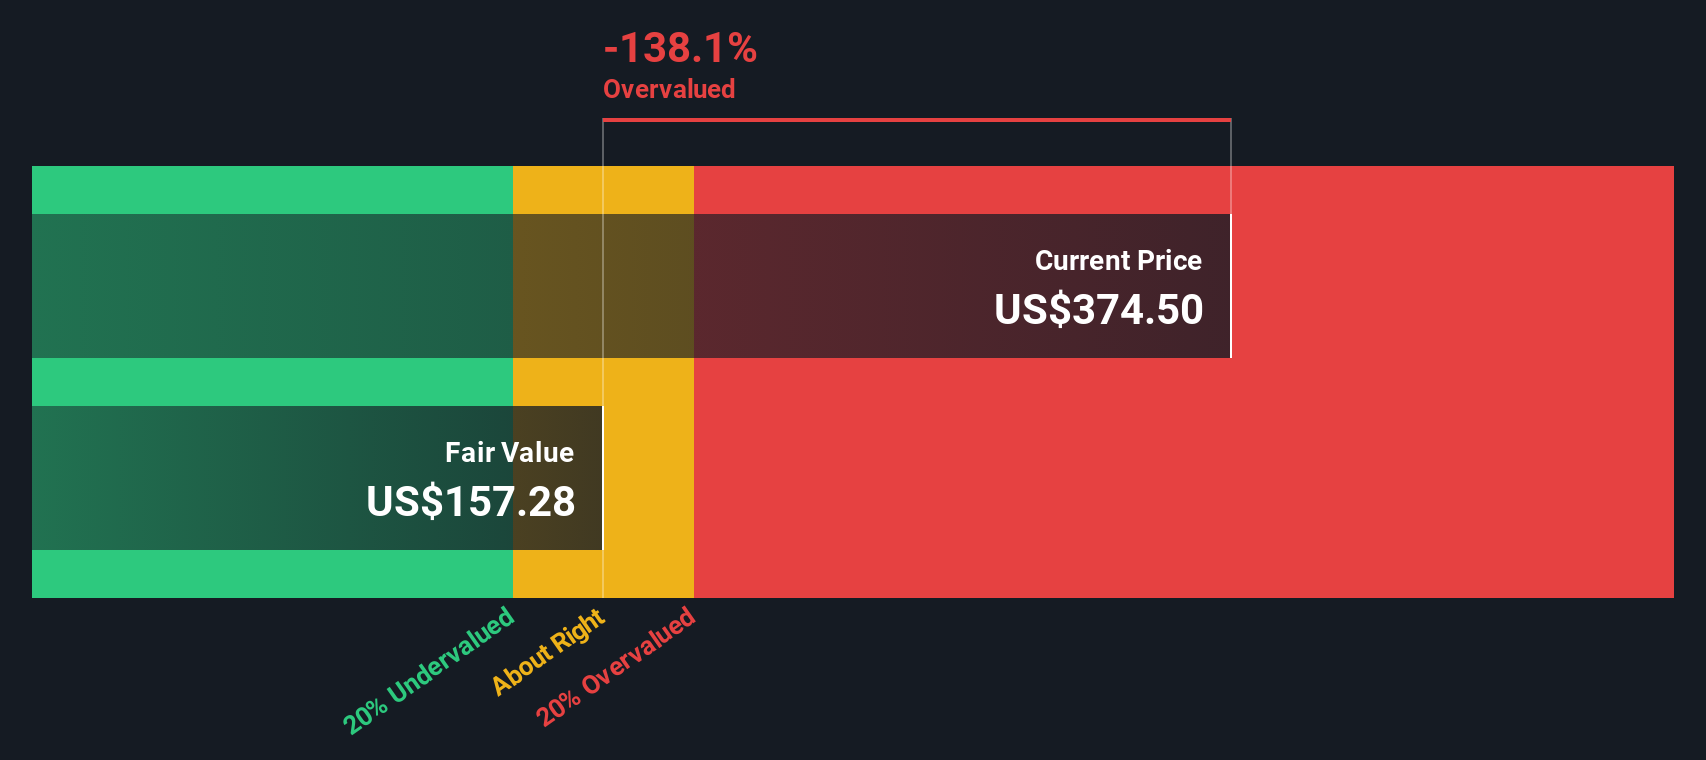
On this basis, the DCF model produces an estimated intrinsic value of about $154 per share. Compared to the current share price in this analysis, this results in an implied overvaluation of roughly 122.0%, meaning the model suggests the market price is significantly higher than the value indicated by these cash flow projections.
Result: OVERVALUED (based on this specific DCF model)
Our Discounted Cash Flow (DCF) analysis suggests Eaton may be overvalued by 122.0%. Discover 899 undervalued stocks or create your own screener to find better value opportunities.
Approach 2: Eaton Price vs Earnings
For profitable, established businesses like Eaton, the Price to Earnings ratio is often the most intuitive way to think about valuation, because it directly links what investors are paying today to the company’s current earnings power.
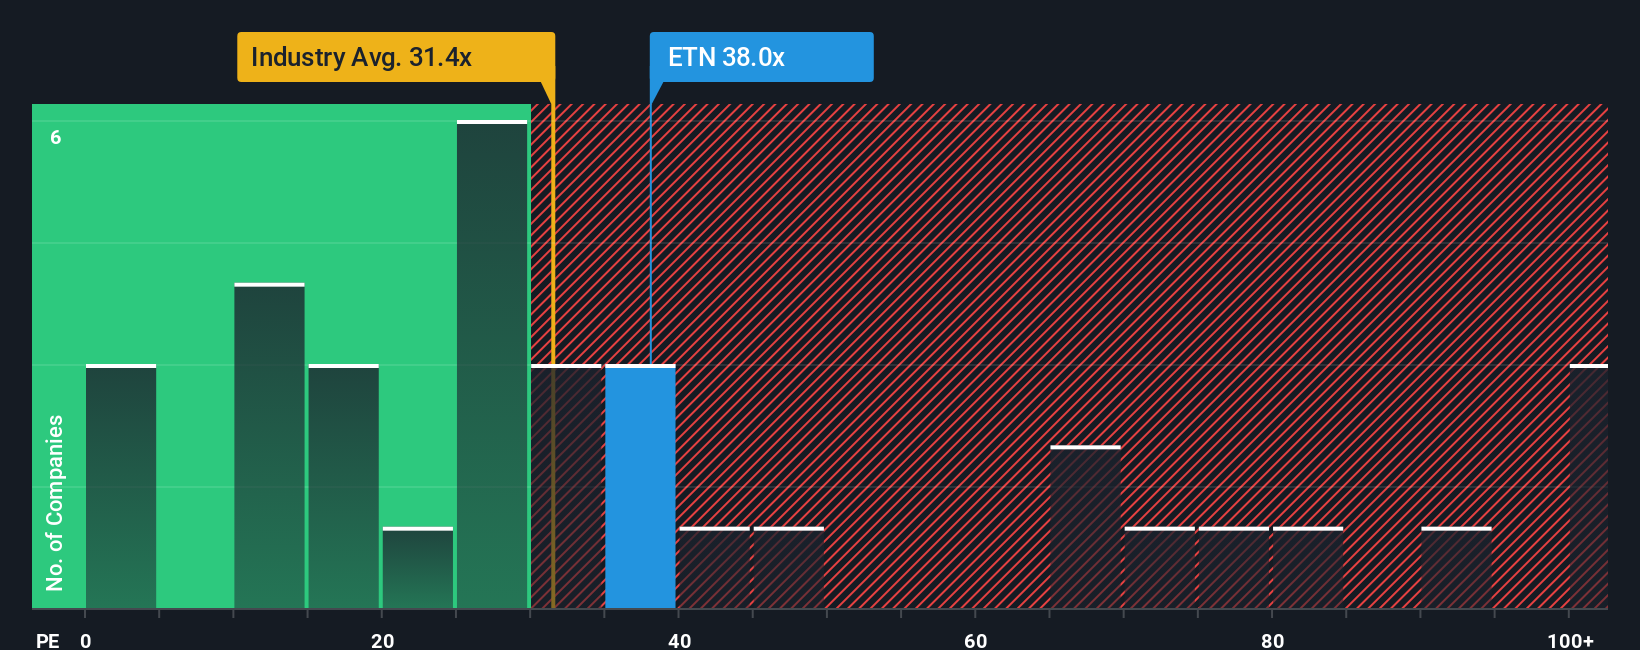
In general, faster growing and less risky companies deserve higher PE ratios, while slower growth, more cyclical, or riskier businesses typically trade on lower multiples. Eaton currently trades at about 33.8x earnings, which is above the Electrical industry average of roughly 30.7x, but below the peer group average of around 45.4x. This suggests the market sees it as higher quality than the sector overall, but not the most aggressively priced name in its space.
Simply Wall St’s Fair Ratio framework goes a step further by estimating what a PE multiple should be, given Eaton’s specific earnings growth outlook, profitability, industry, size, and risk profile. This makes it more tailored than simple peer or industry comparisons, which can be distorted by outliers or structural differences. For Eaton, the Fair Ratio is 38.0x, modestly above the current 33.8x. This implies the shares are trading at a small discount to what its fundamentals might justify.
Result: UNDERVALUED
PE ratios tell one story, but what if the real opportunity lies elsewhere? Discover 1450 companies where insiders are betting big on explosive growth.
Upgrade Your Decision Making: Choose your Eaton Narrative
Earlier we mentioned that there is an even better way to understand valuation, so let us introduce you to Narratives, a simple framework on Simply Wall St’s Community page that lets you attach a clear story to your numbers. It does this by spelling out how you think Eaton’s revenue, earnings, and margins will evolve, linking that story to a financial forecast and then to your own estimated fair value. The platform continuously compares that fair value to the live share price to highlight potential buy or sell opportunities, while automatically updating your Narrative when new earnings, news, or guidance arrives. This allows you to see in real time whether your thesis still holds. You can also see where different investors might, for example, lean bullish with a fair value near the top of the current range around $440 based on robust, durable data center demand and sustained double digit growth, or instead lean cautious with a fair value closer to $288 if they believe AI infrastructure spending and cyclical recovery will prove more volatile and margins harder to expand than the market currently expects.
Do you think there's more to the story for Eaton? Head over to our Community to see what others are saying!
This article by Simply Wall St is general in nature. We provide commentary based on historical data and analyst forecasts only using an unbiased methodology and our articles are not intended to be financial advice. It does not constitute a recommendation to buy or sell any stock, and does not take account of your objectives, or your financial situation. We aim to bring you long-term focused analysis driven by fundamental data. Note that our analysis may not factor in the latest price-sensitive company announcements or qualitative material. Simply Wall St has no position in any stocks mentioned.
Have feedback on this article? Concerned about the content? Get in touch with us directly. Alternatively, email editorial-team@simplywallst.com