
PACS Group (PACS): Taking Stock of Valuation After a 149% One-Year Share Price Surge
PACS Group (PACS) has quietly turned into a strong performer, with the stock up about 149% over the past year as investors warm to its senior care and skilled nursing model.
See our latest analysis for PACS Group.
The recent leg higher to a $31.12 share price caps a powerful run, with the 30 day share price return of about 149% extending an already strong year to date surge and reinforcing the sense that momentum is still building rather than fading.
If PACS Group’s momentum has caught your eye, this could be a good moment to explore similar healthcare names using our curated screener of healthcare stocks for fresh ideas.
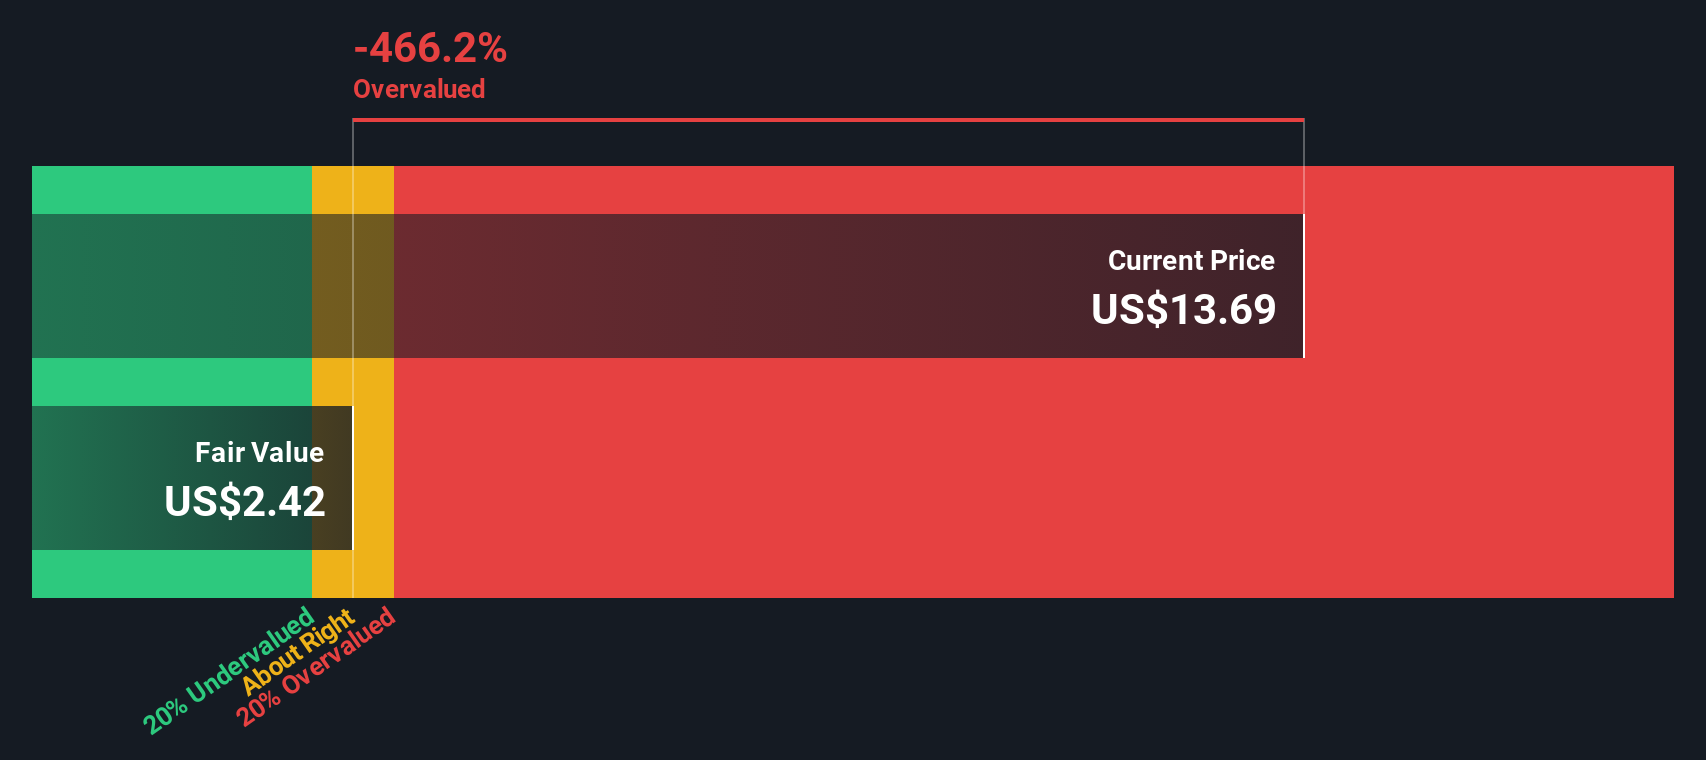
With PACS Group rallying hard yet still trading below analyst targets and some intrinsic value estimates, investors now face a key question: is there overlooked upside remaining, or has the market already priced in its future growth?
Price-to-Earnings of 28.8x: Is it justified?
On a price-to-earnings ratio of 28.8 times, PACS Group looks expensive versus many peers, yet its recent $31.12 close hints investors are willing to pay up for its growth profile.
The price-to-earnings multiple compares the current share price to the company’s earnings per share. It provides a direct snapshot of how much investors are paying for each dollar of profit. For a healthcare operator like PACS Group, where profitability has recently accelerated and earnings are a key driver of value, this metric captures how strongly the market is pricing in future profit expansion.
While PACS trades above both the US Healthcare industry average P/E of 22.1 times and the peer average of 21.9 times, regression based work suggests the fair price-to-earnings ratio for the company could be far higher, at around 62.7 times. That gap implies the current premium might be conservative if the market eventually prices PACS in line with its fair ratio, leaving room for the valuation multiple to expand further if earnings keep delivering.
Explore the SWS fair ratio for PACS Group
Result: Price-to-Earnings of 28.8x (UNDERVALUED)
However, sustained valuation upside still hinges on execution, with any slowdown in revenue growth or regulatory pressure on skilled nursing margins potentially weakening the bull case.
Find out about the key risks to this PACS Group narrative.
Another View: What Does Our DCF Say?
While the 28.8 times earnings multiple suggests PACS Group is undervalued versus its fair ratio, our DCF model paints an even starker picture. It estimates fair value at $148.46 per share, meaning the current $31.12 price implies the stock may be deeply undervalued.
This gap could signal a major opportunity if the cash flow assumptions prove right, or a warning if they are too optimistic and never materialize. Which story do you think the market will end up believing?
Look into how the SWS DCF model arrives at its fair value.
Simply Wall St performs a discounted cash flow (DCF) on every stock in the world every day (check out PACS Group for example). We show the entire calculation in full. You can track the result in your watchlist or portfolio and be alerted when this changes, or use our stock screener to discover 899 undervalued stocks based on their cash flows. If you save a screener we even alert you when new companies match - so you never miss a potential opportunity.
Build Your Own PACS Group Narrative
If you would rather test the numbers yourself and challenge these assumptions, you can build a personalized PACS Group narrative in minutes using Do it your way.
A great starting point for your PACS Group research is our analysis highlighting 3 key rewards and 2 important warning signs that could impact your investment decision.
Ready for more investment ideas?
Once you have weighed up PACS Group, you can push your strategy further by using targeted screeners that surface fresh, data driven opportunities you might otherwise miss.
- Capture potential multi baggers early by reviewing these 3588 penny stocks with strong financials that already show strong financial foundations instead of speculative hype.
- Explore structural trends in healthcare technology by scanning these 30 healthcare AI stocks that use data and automation to support patient outcomes and operational efficiency.
- Strengthen your portfolio core by focusing on these 15 dividend stocks with yields > 3% that combine defined yields with resilient business models for more stable income streams.
This article by Simply Wall St is general in nature. We provide commentary based on historical data and analyst forecasts only using an unbiased methodology and our articles are not intended to be financial advice. It does not constitute a recommendation to buy or sell any stock, and does not take account of your objectives, or your financial situation. We aim to bring you long-term focused analysis driven by fundamental data. Note that our analysis may not factor in the latest price-sensitive company announcements or qualitative material. Simply Wall St has no position in any stocks mentioned.
Have feedback on this article? Concerned about the content? Get in touch with us directly. Alternatively, email editorial-team@simplywallst.com