
Innovent Biologics (SEHK:1801): Reconciling a 116x P/E With DCF-Suggested Upside
Innovent Biologics (SEHK:1801) has been on traders’ radar after a choppy stretch that includes a slight pullback today but a strong rebound over the past year. This has raised questions about what the market is really pricing in.
See our latest analysis for Innovent Biologics.
Despite the recent 1 week share price return of minus 10.07 percent and a 90 day share price return of minus 15.26 percent, Innovent’s 1 year total shareholder return of 121.23 percent signals that momentum is still broadly constructive, although it appears to be cooling in the near term.
If Innovent’s run has you rethinking your healthcare exposure, this could be a good moment to explore other healthcare stocks that might complement your portfolio.
With Innovent still trading at a meaningful discount to analysts’ estimates despite rapid top and bottom line growth, investors now face a pivotal question: is this a genuine entry point, or is the market already pricing in its future expansion?
Price-to-Earnings of 116x: Is it justified?
Innovent Biologics currently trades on a steep price-to-earnings ratio of 116 times, a level that signals the market is paying a heavy premium relative to current profits.
The price-to-earnings multiple compares the share price with earnings per share, making it a direct gauge of how much investors are willing to pay today for each unit of current earnings. For an innovative biotech transitioning to profitability, this ratio often reflects expectations of strong future earnings expansion rather than the earnings base today.
In Innovent’s case, forecasts of earnings growth of around the high twenties per year and the company’s recent move into profitability help explain why investors might accept such a lofty multiple in the short term. However, our analysis indicates that a fair price-to-earnings ratio based on underlying drivers would be closer to 31.7 times, a markedly lower level that highlights how far sentiment has run ahead of that fair benchmark.
Relative to the broader Asian biotechs industry average of 39.1 times earnings and a peer average of 44.1 times, Innovent’s 116 times stands out as aggressively valued, suggesting the market is factoring in much faster and more durable profit growth than is implied for its sector and closest comparables.
Explore the SWS fair ratio for Innovent Biologics
Result: Price-to-earnings of 116x (OVERVALUED)
However, investors should not ignore risks such as clinical or regulatory setbacks and intensifying competition, which could temper the high growth and valuation narrative.
Find out about the key risks to this Innovent Biologics narrative.
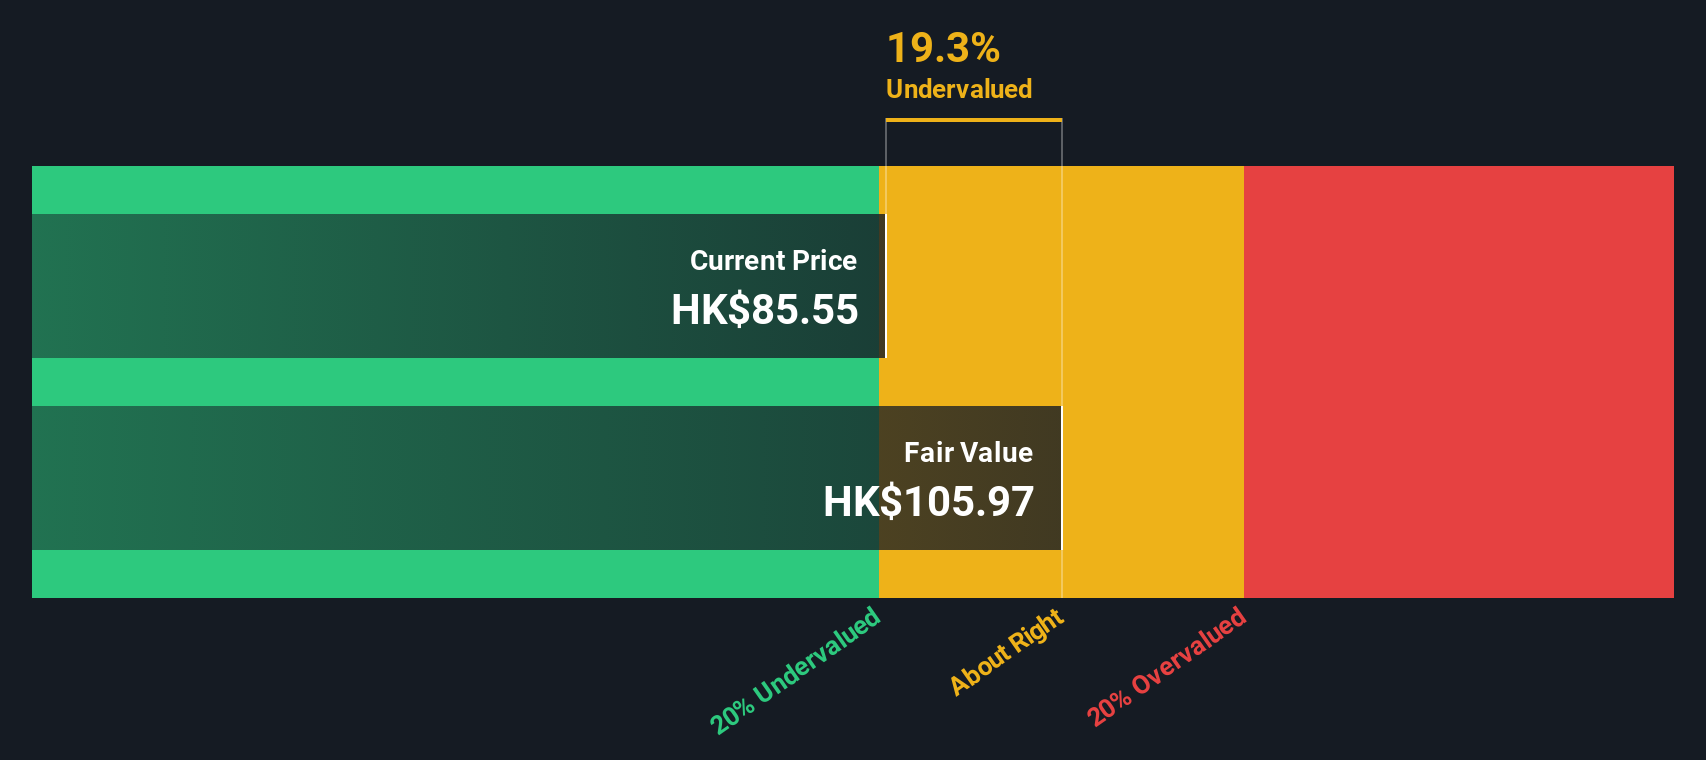
Another View: Discounted Cash Flow Signals Upside
While the 116 times earnings multiple looks stretched, our DCF model paints a different picture. It suggests Innovent is trading about 31 percent below its fair value at roughly HK$122.34. If cash flows justify a higher price, is the market underestimating the long game here?
Look into how the SWS DCF model arrives at its fair value.
Simply Wall St performs a discounted cash flow (DCF) on every stock in the world every day (check out Innovent Biologics for example). We show the entire calculation in full. You can track the result in your watchlist or portfolio and be alerted when this changes, or use our stock screener to discover 899 undervalued stocks based on their cash flows. If you save a screener we even alert you when new companies match - so you never miss a potential opportunity.
Build Your Own Innovent Biologics Narrative
If you see the story differently or want to dig into the numbers yourself, you can build a custom view in minutes: Do it your way.
A good starting point is our analysis highlighting 4 key rewards investors are optimistic about regarding Innovent Biologics.
Ready for your next investing move?
Use the Simply Wall Street Screener today to pinpoint fresh ideas that match your strategy, so you are not stuck watching others capture potential future gains.
- Uncover hidden value by targeting businesses trading below their cash flow potential with these 899 undervalued stocks based on cash flows, and position yourself ahead of a potential re-rating.
- Accelerate your growth hunt by zeroing in on cutting edge innovators using these 27 AI penny stocks, where disruptive themes and strong momentum often collide.
- Strengthen your income stream by focusing on reliable payers through these 15 dividend stocks with yields > 3%, and aim for consistent cash returns alongside long term capital growth.
This article by Simply Wall St is general in nature. We provide commentary based on historical data and analyst forecasts only using an unbiased methodology and our articles are not intended to be financial advice. It does not constitute a recommendation to buy or sell any stock, and does not take account of your objectives, or your financial situation. We aim to bring you long-term focused analysis driven by fundamental data. Note that our analysis may not factor in the latest price-sensitive company announcements or qualitative material. Simply Wall St has no position in any stocks mentioned.
Have feedback on this article? Concerned about the content? Get in touch with us directly. Alternatively, email editorial-team@simplywallst.com