
Is It Too Late To Consider Wells Fargo After Its 2025 Recovery Rally?
- If you are wondering whether Wells Fargo is still attractive after its big recovery, or if most of the upside is already priced in, you are not alone in trying to pin down what this stock is really worth today.
- After a strong run that has the stock up 26.6% year to date and 26.8% over the last year, shorter-term moves have cooled a bit. The stock has gained 3.2% over the last 30 days and seen a small 0.5% pullback in the last week, which hints at some hesitation around the current price.
- Recent headlines have focused on Wells Fargo's ongoing efforts to streamline operations and strengthen its balance sheet, alongside continued regulatory scrutiny that keeps risk perceptions in focus. At the same time, investors are watching management's progress on efficiency targets and capital returns, which helps explain why the market has been willing to rerate the stock over the past few years.
- On our framework, Wells Fargo scores a 2/6 valuation check score. This suggests the market might be getting ahead of itself on some metrics but not all. Next, we will unpack what different valuation approaches say about the stock today and then finish with a more holistic way to think about its true value.
Wells Fargo scores just 2/6 on our valuation checks. See what other red flags we found in the full valuation breakdown.
Approach 1: Wells Fargo Excess Returns Analysis
The Excess Returns model looks at how much profit Wells Fargo can generate above the return that investors reasonably demand on its equity, and then capitalizes those surplus profits into an intrinsic value per share.
On this view, Wells Fargo starts from a solid capital base, with Book Value of $52.25 per share and a Stable Book Value estimate of $56.11 per share, based on forward looking consensus from 14 analysts. The bank is expected to earn Stable EPS of $7.29 per share, driven by an Average Return on Equity of 12.98%, which is comfortably above its estimated Cost of Equity of $4.60 per share.
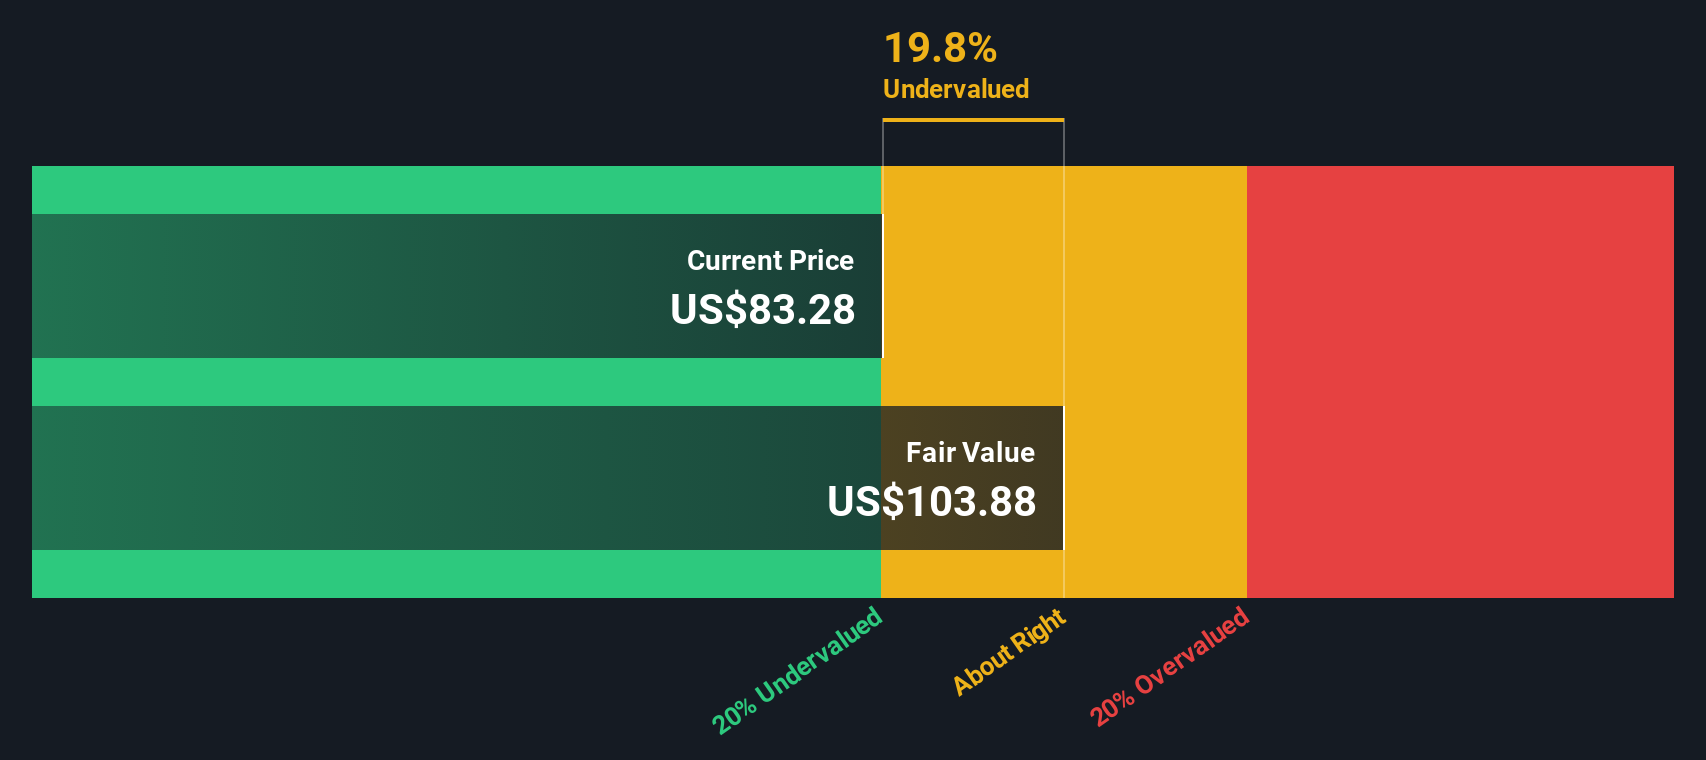
The difference between what the bank earns and what investors require, the Excess Return, is estimated at $2.69 per share. When those excess returns are projected forward and capitalized, the model arrives at an intrinsic value of about $110.58 per share, implying the stock is roughly 19.6% undervalued relative to its current price.
Result: UNDERVALUED
Our Excess Returns analysis suggests Wells Fargo is undervalued by 19.6%. Track this in your watchlist or portfolio, or discover 896 more undervalued stocks based on cash flows.
Approach 2: Wells Fargo Price vs Earnings
For a consistently profitable bank like Wells Fargo, the Price to Earnings multiple is a natural way to value the stock because it directly links what investors pay today to the profits the business is generating each year.
In general, faster earnings growth and lower perceived risk justify a higher PE ratio, while slower growth and higher risk usually mean a lower, more conservative multiple is appropriate. This makes context essential when judging whether a given PE looks rich or reasonable.
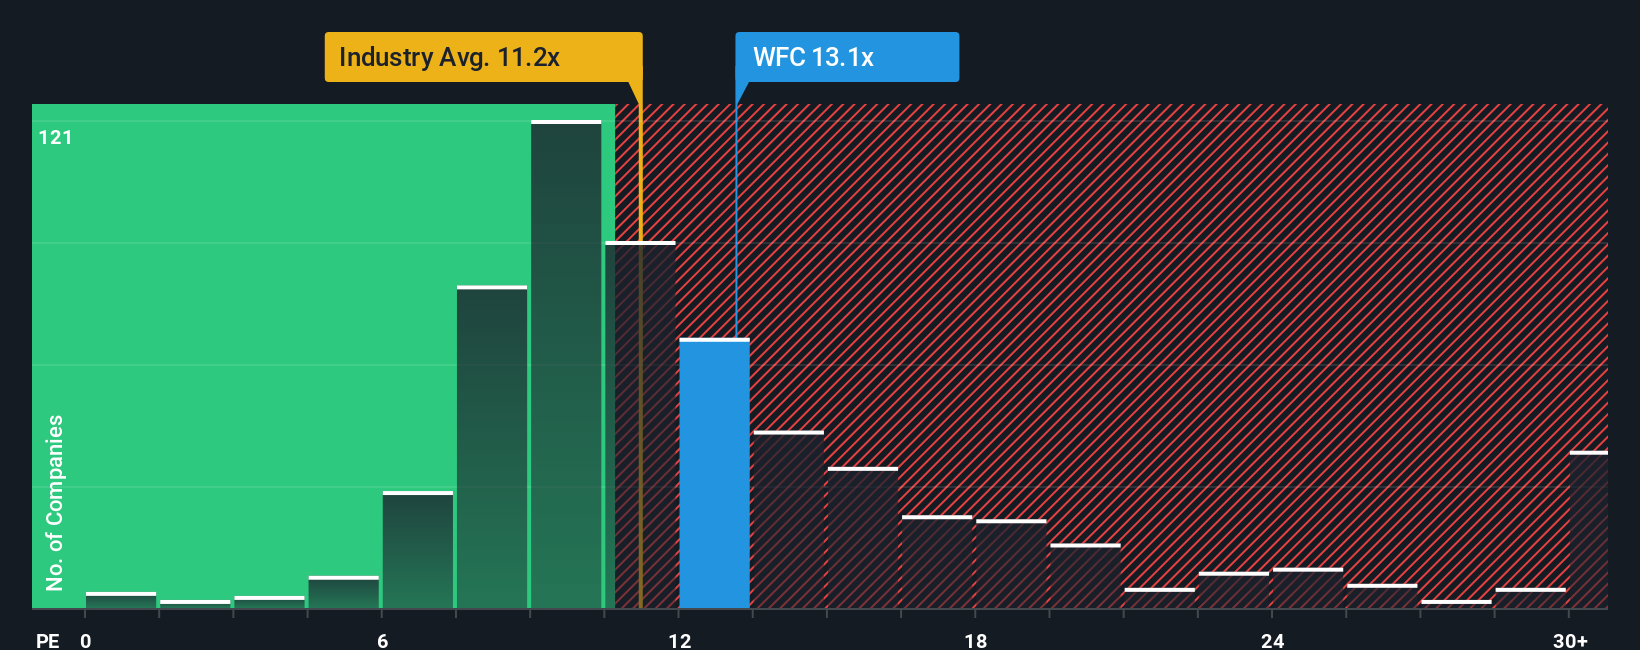
Wells Fargo currently trades on about 13.97x earnings, slightly above the broader Banks industry average of roughly 11.65x and also ahead of its peer group at around 13.26x. Simply Wall St's Fair Ratio for Wells Fargo sits higher at about 15.57x, which reflects what investors might reasonably pay given its specific mix of earnings growth, profitability, size and risk profile.
The Fair Ratio is more informative than a simple peer or industry comparison because it adjusts for company level factors, rather than assuming all banks deserve the same multiple. With the market paying 13.97x versus a Fair Ratio of 15.57x, Wells Fargo appears modestly undervalued on this measure.
Result: UNDERVALUED
PE ratios tell one story, but what if the real opportunity lies elsewhere? Discover 1450 companies where insiders are betting big on explosive growth.
Upgrade Your Decision Making: Choose your Wells Fargo Narrative
Earlier we mentioned that there is an even better way to understand valuation, so let us introduce you to Narratives, a simple way to connect your view of Wells Fargo’s future with a concrete fair value estimate. A Narrative is your story behind the numbers, where you spell out how you think revenue, earnings and margins will develop, and then link that story to a financial forecast and an implied fair value per share. On Simply Wall St, Narratives live in the Community page, where millions of investors use them as an easy, accessible tool to decide whether to buy, hold or sell by directly comparing their Fair Value to today’s Price. Because Narratives are built on live data, they automatically update when new earnings, news or regulatory developments hit, so your story stays current without extra work. For example, one Wells Fargo Narrative might assume a fair value near $72, reflecting cautious growth and margin pressure, while another might see fair value closer to $95, assuming faster growth, gradually improving profitability and a higher future PE multiple.
For Wells Fargo however we'll make it really easy for you with previews of two leading Wells Fargo Narratives:
Fair value: $93.71 per share
Implied undervaluation: -5.14%
Forecast revenue growth: 7.01%
- Assumes regulatory shackles continue to ease, allowing Wells Fargo to grow its balance sheet, expand fee income, and benefit from scalable digital and wealth management platforms.
- Builds in around 7% annual revenue growth and mid 20s profit margins, underpinned by cost discipline, technology investment, and share buybacks that steadily lift earnings per share.
- Sees the current price as slightly below a steadily rising fair value, while still flagging competition, digital execution risks, and lingering regulatory demands as key uncertainties.
Fair value: $74.70 per share
Implied overvaluation: 18.96%
Forecast revenue growth: 3.00%
- Views Wells Fargo as modestly overvalued relative to a more cautious fair value, even though headline valuation multiples look low versus the broader market.
- Assumes only low single digit revenue growth and a conservative future PE multiple, reflecting macro headwinds in housing and manufacturing and a slower growth backdrop.
- Still acknowledges Wells Fargo's wide customer base, low funding costs, and potential benefit from regulatory relief, but sees these positives as already well reflected in the current share price.
Do you think there's more to the story for Wells Fargo? Head over to our Community to see what others are saying!

This article by Simply Wall St is general in nature. We provide commentary based on historical data and analyst forecasts only using an unbiased methodology and our articles are not intended to be financial advice. It does not constitute a recommendation to buy or sell any stock, and does not take account of your objectives, or your financial situation. We aim to bring you long-term focused analysis driven by fundamental data. Note that our analysis may not factor in the latest price-sensitive company announcements or qualitative material. Simply Wall St has no position in any stocks mentioned.
Have feedback on this article? Concerned about the content? Get in touch with us directly. Alternatively, email editorial-team@simplywallst.com