
Is NXP Semiconductors Fairly Priced After Recent 11.2% Share Price Jump?
- Wondering if NXP Semiconductors is still a smart buy at around $228, or if most of the upside has already been priced in? This article unpacks what the current share price might be implying about its future.
- Over the last month the stock has climbed 11.2%, adding to a 10.6% gain year to date and a 40.6% return over three years. However, the 1-year return of 5.7% shows that momentum has not been in a straight line.
- Recent attention around NXP has centered on its role in automotive and industrial chips, as investors consider how rising demand for power management and edge processing will support longer term growth. At the same time, broader market debates about interest rates and the chip cycle have nudged valuations for many semiconductor names higher, pulling NXP along with them.
- Right now NXP scores a 3/6 valuation check score. This suggests the stock looks undervalued on some metrics but not across the board. In the sections ahead we will break down what different valuation methods indicate, before finishing with a more holistic way of thinking about its overall worth.
Find out why NXP Semiconductors's 5.7% return over the last year is lagging behind its peers.
Approach 1: NXP Semiconductors Discounted Cash Flow (DCF) Analysis
A Discounted Cash Flow model estimates what a business is worth by projecting the cash it can generate in the future and then discounting those cash flows back to today. For NXP Semiconductors, this approach uses a 2 stage Free Cash Flow to Equity framework based on cash flow projections.
NXP currently generates trailing twelve month free cash flow of about $1.52 Billion. Analyst estimates and extrapolations from Simply Wall St see this rising to around $4.62 Billion by 2029, with further annual increases implied over the following years as free cash flow growth gradually slows. These projections, all in $, are then discounted to reflect the risk and time value of money.
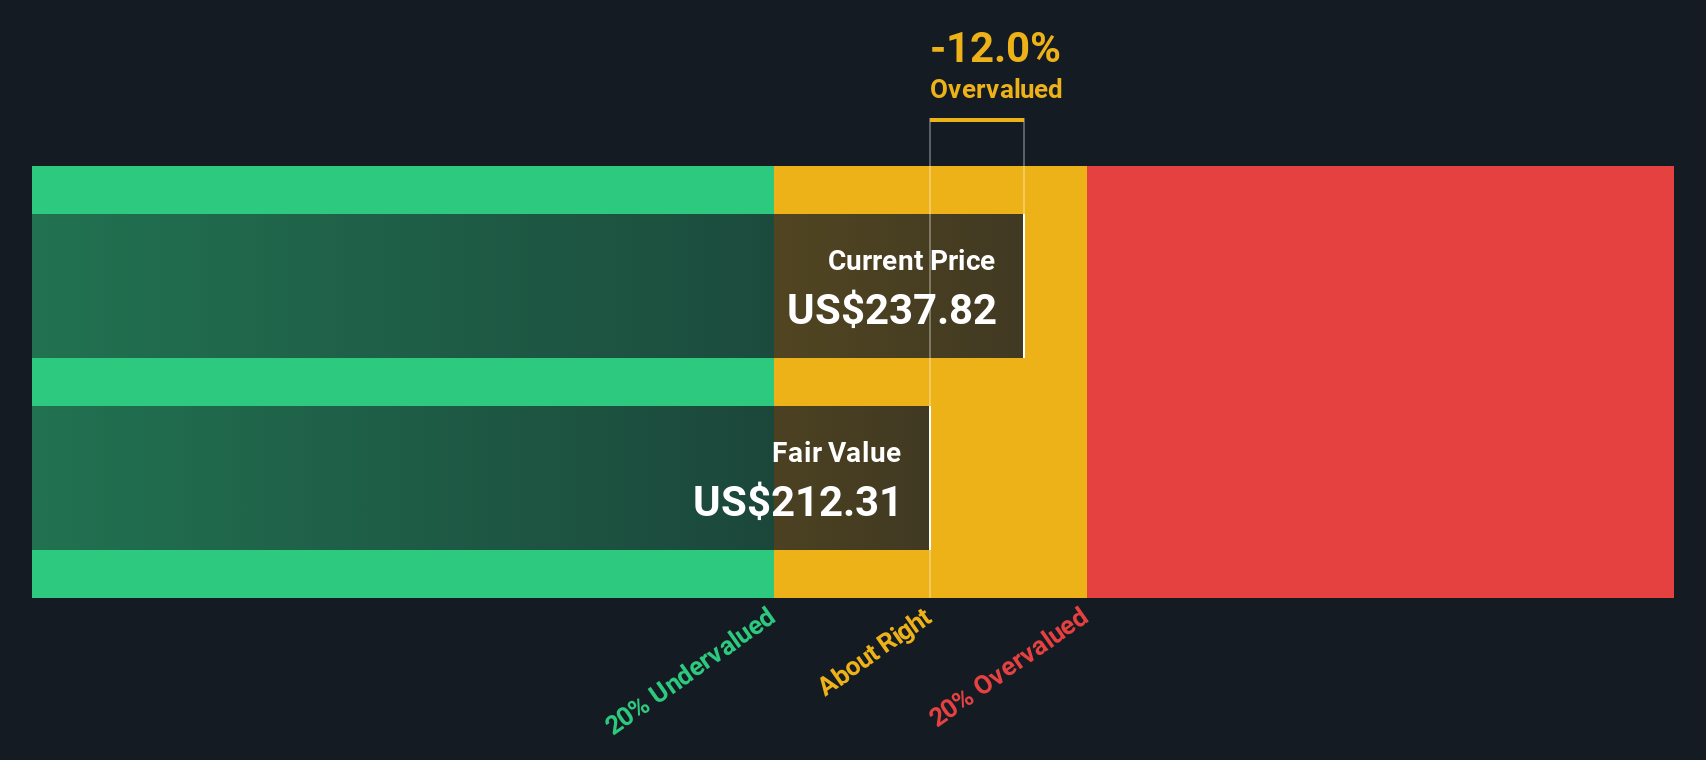
When all projected cash flows are added together, the DCF model indicates an intrinsic value of roughly $218.88 per share. Compared with the recent share price around $228, the model suggests the stock is about 4.2% overvalued, which is a relatively small gap and well within a typical margin of error for such forecasts.
Result: ABOUT RIGHT
NXP Semiconductors is fairly valued according to our Discounted Cash Flow (DCF), but this can change at a moment's notice. Track the value in your watchlist or portfolio and be alerted on when to act.
Approach 2: NXP Semiconductors Price vs Earnings
For a profitable, established business like NXP Semiconductors, the price to earnings, or PE, ratio is a practical way to gauge valuation because it directly links what investors pay to the profits the company generates today. In general, faster growth and lower perceived risk justify a higher PE, while slower growth or higher uncertainty typically mean a lower, more conservative multiple is appropriate.
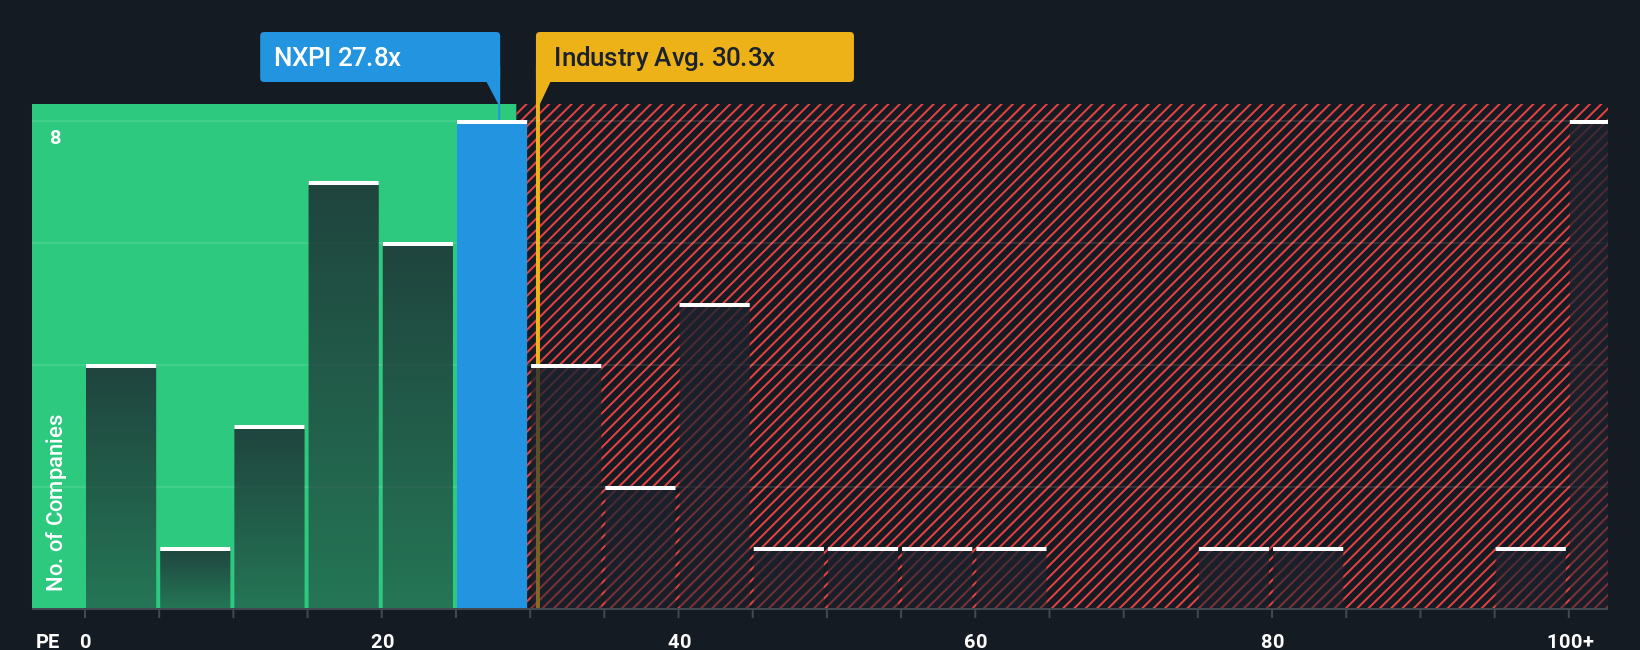
NXP currently trades on a PE of about 27.8x, which sits below both the broader Semiconductor industry average of roughly 37.9x and the even richer peer group average near 74.0x. Simply Wall St also calculates a proprietary “Fair Ratio” of around 31.2x, which is the PE you might expect given NXP’s earnings growth outlook, profit margins, industry positioning, market cap and risk profile. This Fair Ratio goes beyond simple peer and industry comparisons because it adjusts for company specific qualities rather than assuming all chipmakers deserve the same multiple.
Set against this Fair Ratio of 31.2x, NXP’s current 27.8x PE suggests the shares trade at a discount that looks modestly attractive rather than stretched.
Result: UNDERVALUED
PE ratios tell one story, but what if the real opportunity lies elsewhere? Discover 1450 companies where insiders are betting big on explosive growth.
Upgrade Your Decision Making: Choose your NXP Semiconductors Narrative
Earlier we mentioned that there is an even better way to understand valuation, so let us introduce you to Narratives, which are simply the story you believe about a company, translated into numbers like fair value, future revenue, earnings and margins. A Narrative links what you think will drive NXP’s business, such as automotive design wins or China competition, to a concrete financial forecast and then to a fair value estimate you can compare with today’s share price. Narratives on Simply Wall St’s Community page are easy to use, available to millions of investors, and help you decide whether NXP looks like a buy, hold or sell by showing if your Fair Value sits above or below the current market Price. Because they update dynamically when fresh information arrives, such as earnings or major news, your view stays aligned with reality instead of going stale. For example, one NXP Narrative might see fair value close to the bullish 289 dollars target, while another, more cautious view might anchor around the bearish 210 dollars, reflecting very different expectations about growth, margins and risk.
Do you think there's more to the story for NXP Semiconductors? Head over to our Community to see what others are saying!

This article by Simply Wall St is general in nature. We provide commentary based on historical data and analyst forecasts only using an unbiased methodology and our articles are not intended to be financial advice. It does not constitute a recommendation to buy or sell any stock, and does not take account of your objectives, or your financial situation. We aim to bring you long-term focused analysis driven by fundamental data. Note that our analysis may not factor in the latest price-sensitive company announcements or qualitative material. Simply Wall St has no position in any stocks mentioned.
Have feedback on this article? Concerned about the content? Get in touch with us directly. Alternatively, email editorial-team@simplywallst.com