
Has Ipsen’s Multi Year Surge Left Much Upside After Recent Pipeline Progress?
- Wondering if Ipsen is still a smart buy after its strong multi year run, or if most of the upside is already priced in? This breakdown will help you decide whether the current tag looks compelling or stretched.
- The stock has been roughly flat over the last week and month, but it is still up 9.2% year to date, 13.5% over the past year, and a hefty 90.2% over five years, which naturally raises questions about future return potential and changing risk perceptions.
- Recent headlines have focused on Ipsen’s continued pipeline execution and strategic portfolio moves in specialty care, reinforcing its positioning in oncology and rare diseases while keeping investors interested in its long term growth optionality. At the same time, regulatory and competitive developments in pharmaceuticals have reminded the market that even strong operators like Ipsen need a margin of safety on valuation.
- On our framework, Ipsen currently scores a 3 out of 6 valuation checks, suggesting it looks undervalued on some measures but not across the board. In the next sections we will walk through those different approaches to valuation before ending with a more holistic way to think about what the stock is really worth.
Approach 1: Ipsen Discounted Cash Flow (DCF) Analysis
A Discounted Cash Flow model estimates what a company is worth by projecting the cash it can generate in the future and then discounting those cash flows back to today, to reflect risk and the time value of money.
For Ipsen, the latest twelve month free cash flow is about €516.8 million. Analysts provide detailed forecasts for the next few years, and beyond that Simply Wall St extrapolates the trend to build a longer term view. Under this two stage Free Cash Flow to Equity approach, Ipsen’s free cash flow is projected to rise to around €640 million by 2029, with further gradual changes in the following years as growth normalises.
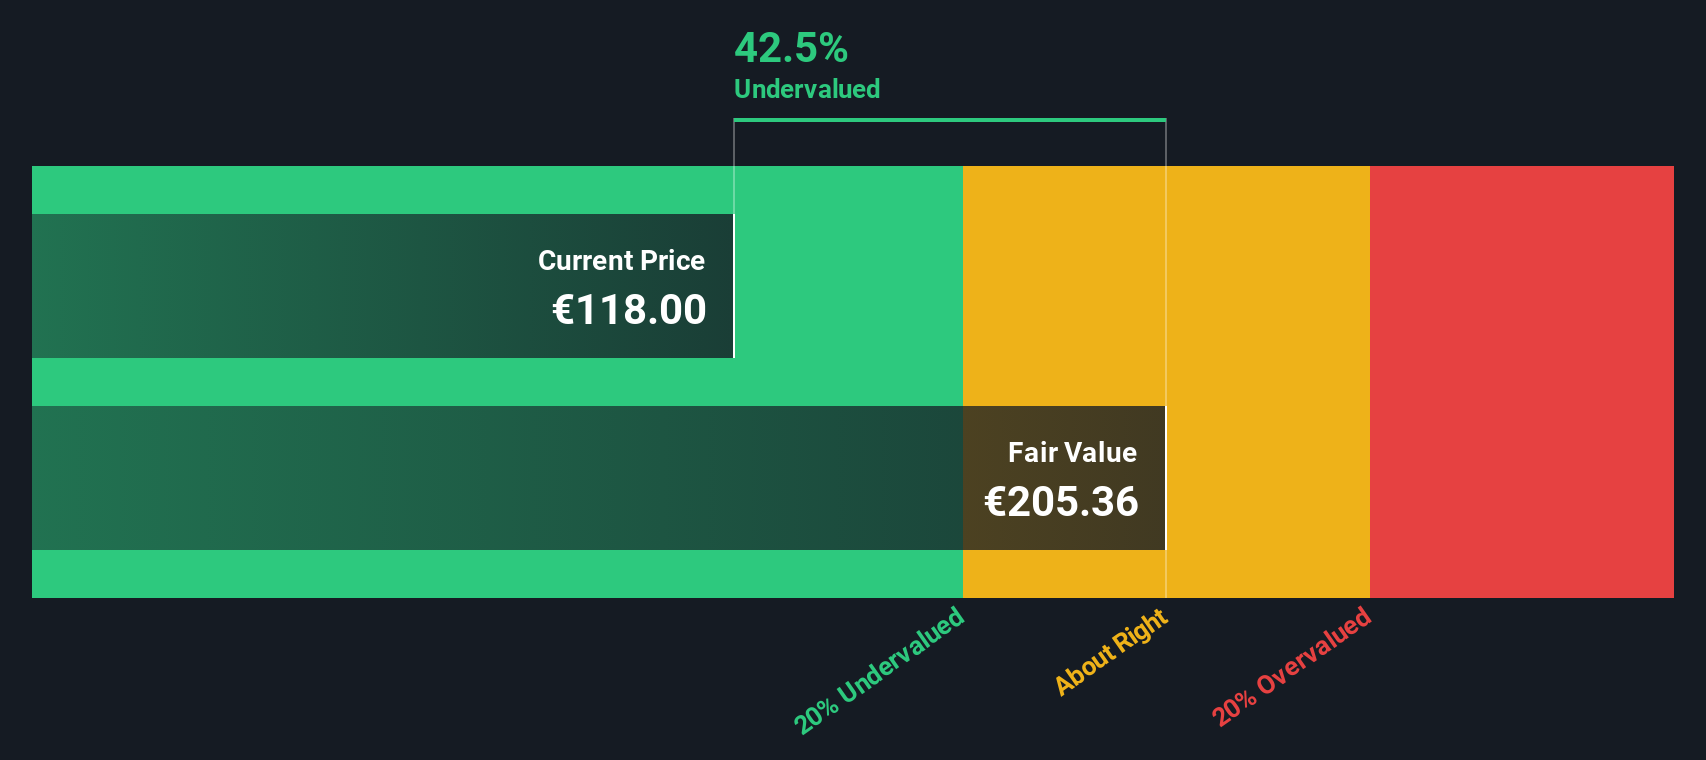
When all those projected cash flows are discounted back, the model arrives at an estimated intrinsic value of roughly €157.76 per share. Compared with the current share price, this implies Ipsen trades at about a 21.7% discount, which in this model indicates the stock is modestly undervalued based purely on its cash generation potential.
Result: UNDERVALUED
Our Discounted Cash Flow (DCF) analysis suggests Ipsen is undervalued by 21.7%. Track this in your watchlist or portfolio, or discover 896 more undervalued stocks based on cash flows.
Approach 2: Ipsen Price vs Earnings
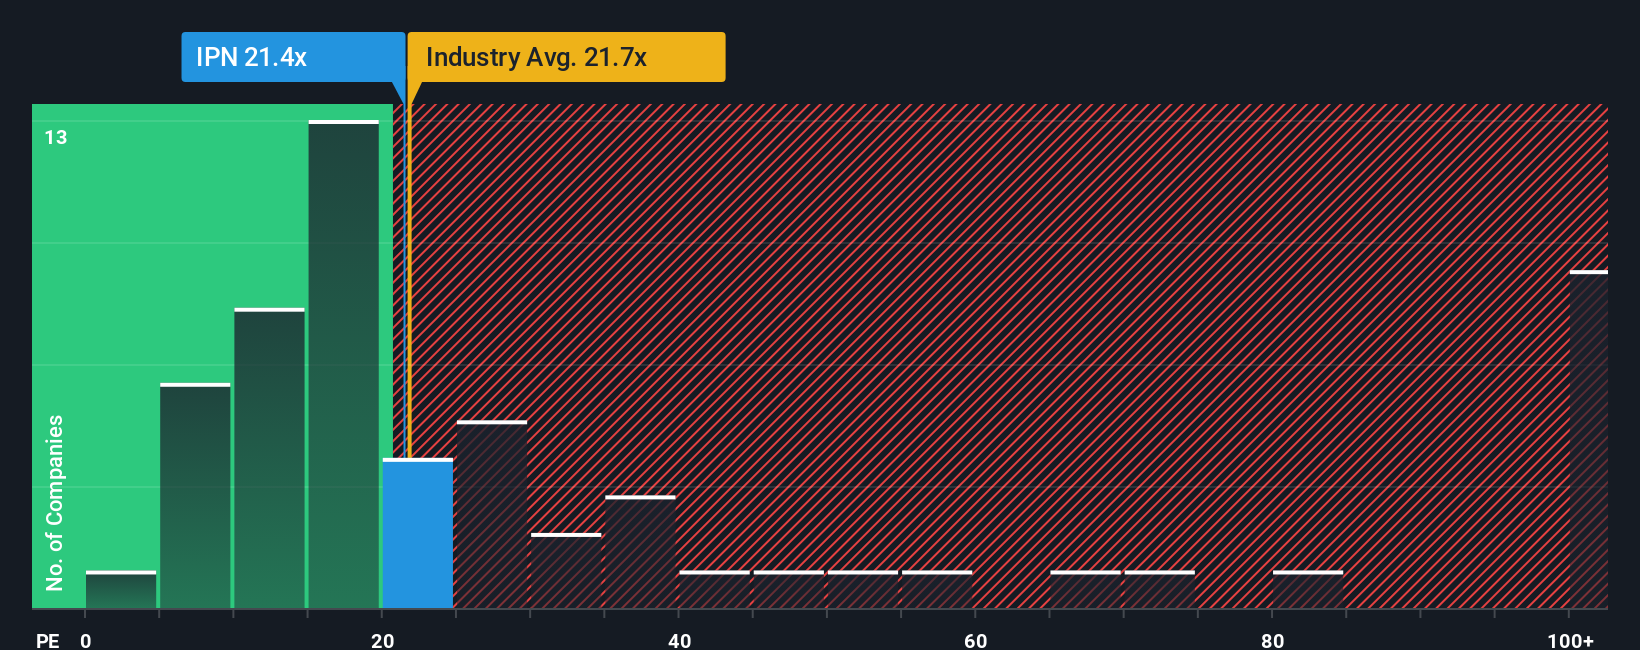
For profitable companies like Ipsen, the Price to Earnings ratio is a useful way to gauge valuation because it links what investors pay directly to the profits the business is currently generating. A higher or lower PE can be justified depending on how fast earnings are expected to grow and how risky or cyclical those earnings are, so what counts as a normal or fair PE is partly a reflection of those expectations.
Ipsen currently trades on a PE of about 22.64x, which is almost identical to the broader Pharmaceuticals industry average of around 22.64x and a bit higher than the peer group average of roughly 19.93x. Simply Wall St’s Fair Ratio for Ipsen is 17.23x, a proprietary estimate of the PE the company should trade on after adjusting for its earnings growth outlook, profit margins, risk profile, industry positioning and market capitalization. This makes it more tailored than a simple comparison with peers or the sector, which can overlook important differences in quality and risk. On this basis, Ipsen’s actual PE sits meaningfully above its Fair Ratio, suggesting the shares look somewhat expensive on earnings.
Result: OVERVALUED
PE ratios tell one story, but what if the real opportunity lies elsewhere? Discover 1450 companies where insiders are betting big on explosive growth.
Upgrade Your Decision Making: Choose your Ipsen Narrative
Earlier we mentioned that there is an even better way to understand valuation, so let us introduce you to Narratives, an approach that lets you put a clear story behind the numbers. It ties your view of Ipsen’s products, competition and execution to assumptions about its future revenue, earnings and margins, and then translates that into a Fair Value you can compare against today’s share price to decide whether to buy, hold or sell.
On Simply Wall St’s Community page, used by millions of investors, Narratives make this process accessible by guiding you to link a company’s story to a financial forecast and then to a valuation. They automatically update when new information such as earnings releases, guidance changes or major drug approvals appears, so your view does not go stale.
For Ipsen, one investor might build a bullish Narrative around strong rare disease launches, resilient margins and accretive deals and arrive at a Fair Value near the top end of analyst targets around €155. Another, more cautious Narrative could emphasize Somatuline competition and pricing pressure and land closer to €105, with the platform showing in real time whether the current price leaves enough upside for your chosen story.
Do you think there's more to the story for Ipsen? Head over to our Community to see what others are saying!

This article by Simply Wall St is general in nature. We provide commentary based on historical data and analyst forecasts only using an unbiased methodology and our articles are not intended to be financial advice. It does not constitute a recommendation to buy or sell any stock, and does not take account of your objectives, or your financial situation. We aim to bring you long-term focused analysis driven by fundamental data. Note that our analysis may not factor in the latest price-sensitive company announcements or qualitative material. Simply Wall St has no position in any stocks mentioned.
Have feedback on this article? Concerned about the content? Get in touch with us directly. Alternatively, email editorial-team@simplywallst.com