
Is TTM Technologies Still Attractive After a 212% Surge and Lofty Growth Expectations in 2025?
- If you are wondering whether TTM Technologies is still a smart buy after such a massive run, you are not alone. This breakdown aims to cut through the noise around its current price tag.
- The stock has rocketed, up 14.9% over the last week, 9.8% over the past month, and an eye catching 212.2% year to date, with a 202.8% gain over the last year that has completely changed how the market sees its potential.
- Much of this momentum has been fueled by growing optimism around TTM’s role in high demand areas like advanced PCBs for 5G infrastructure and defense electronics, which investors see as long term growth engines. At the same time, headlines about reshoring of manufacturing capacity and tighter supply chains have positioned TTM as a beneficiary of broader industry shifts, not just a cyclical play.
- Despite the hype, our valuation checks currently give TTM Technologies a score of 1 out of 6, suggesting the market might be pricing in a lot of good news already. Next we will walk through different valuation approaches to see what is really baked into the share price, before finishing with a more holistic way to think about TTM’s true value.
TTM Technologies scores just 1/6 on our valuation checks. See what other red flags we found in the full valuation breakdown.
Approach 1: TTM Technologies Discounted Cash Flow (DCF) Analysis
A Discounted Cash Flow model estimates what a company is worth by projecting its future cash flows and then discounting those back to today in $ terms.
For TTM Technologies, the latest twelve month Free Cash Flow (FCF) is about $91.9 million. Analysts and extrapolated estimates see FCF rising to roughly $245.0 million by 2035, with notable step ups such as $136.8 million projected for 2027. Simply Wall St uses a 2 Stage Free Cash Flow to Equity model, where earlier years rely more on analyst forecasts and later years on gradually slowing growth assumptions.
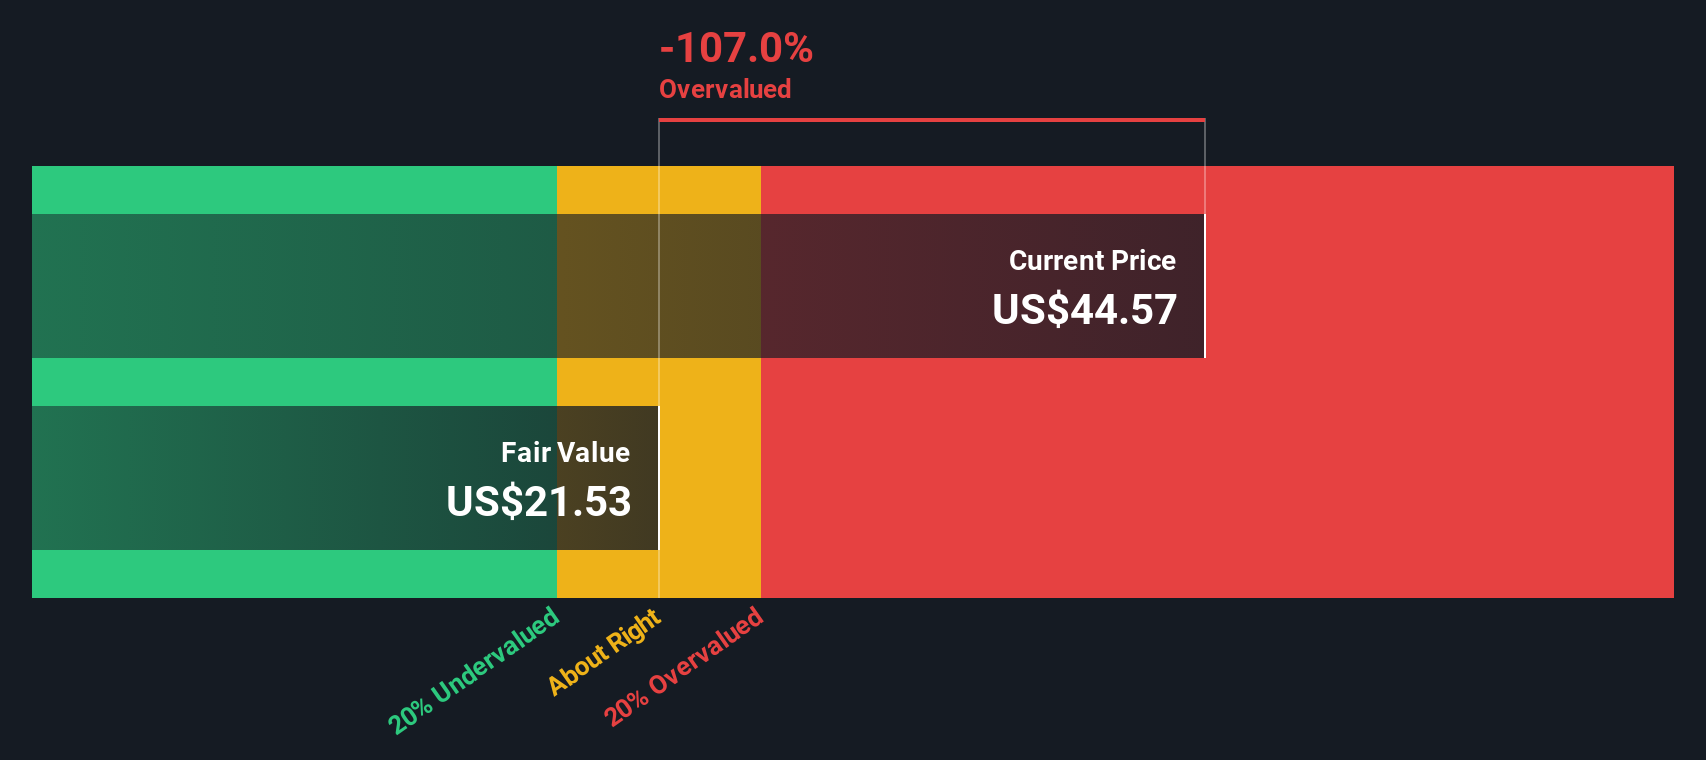
When all those future $ cash flows are discounted back to today, one model arrives at an estimated intrinsic value of about $29.84 per share. Compared with the current share price, this output suggests the stock may be significantly overvalued under these assumptions, indicating the market is pricing in stronger outcomes than this particular cash flow outlook currently reflects.
Result: OVERVALUED (model-based estimate)
Our Discounted Cash Flow (DCF) analysis suggests TTM Technologies may be overvalued by 157.1%. Discover 896 undervalued stocks or create your own screener to find better value opportunities.
Approach 2: TTM Technologies Price vs Earnings
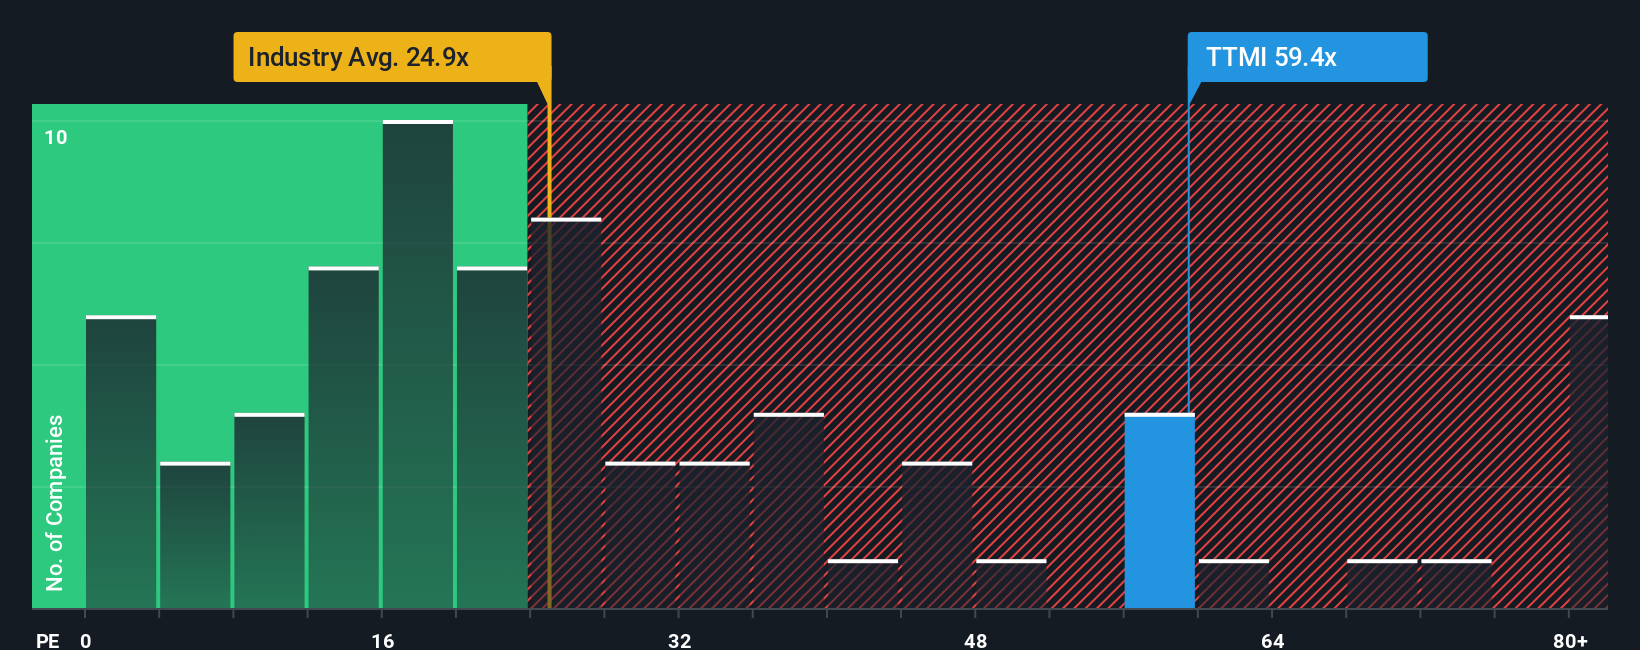
For a profitable business like TTM Technologies, the price to earnings (PE) ratio is a practical way to gauge whether investors are paying a reasonable price for each dollar of current earnings. In general, companies with stronger growth prospects and lower perceived risk can justify a higher PE, while slower growth or higher uncertainty usually calls for a lower, more conservative multiple.
TTM currently trades at about 60.10x earnings, which is slightly below the peer average of 62.51x but well above the broader Electronic industry average of 24.55x. To move beyond these blunt comparisons, Simply Wall St uses a proprietary Fair Ratio, which estimates what PE a company should trade on given its earnings growth profile, industry, profit margins, market cap and specific risks. For TTM, this Fair Ratio is 33.99x.
This Fair Ratio provides a more tailored benchmark than simply lining TTM up against its sector or a basket of peers, because it bakes in company specific strengths and weaknesses rather than assuming one size fits all. Comparing 60.10x to the 33.99x Fair Ratio suggests the market is paying a meaningful premium to what these fundamentals would typically support.
Result: OVERVALUED
PE ratios tell one story, but what if the real opportunity lies elsewhere? Discover 1450 companies where insiders are betting big on explosive growth.
Upgrade Your Decision Making: Choose your TTM Technologies Narrative
Earlier we mentioned that there is an even better way to understand valuation, so let us introduce you to Narratives, a simple way to connect your view of TTM Technologies’ story with the numbers you think are realistic for its future revenue, earnings, margins and fair value.
A Narrative on Simply Wall St is your own storyline for a company that links what you believe about its competitive position, growth drivers and risks to a concrete financial forecast. This then flows through to an estimated fair value you can compare against today’s share price to decide whether to buy, hold or sell.
Narratives live inside the Community page on Simply Wall St and are used by millions of investors. They update dynamically as fresh information such as earnings releases or news hits the market. This means your fair value view can evolve as the facts change, without you rebuilding the whole model from scratch.
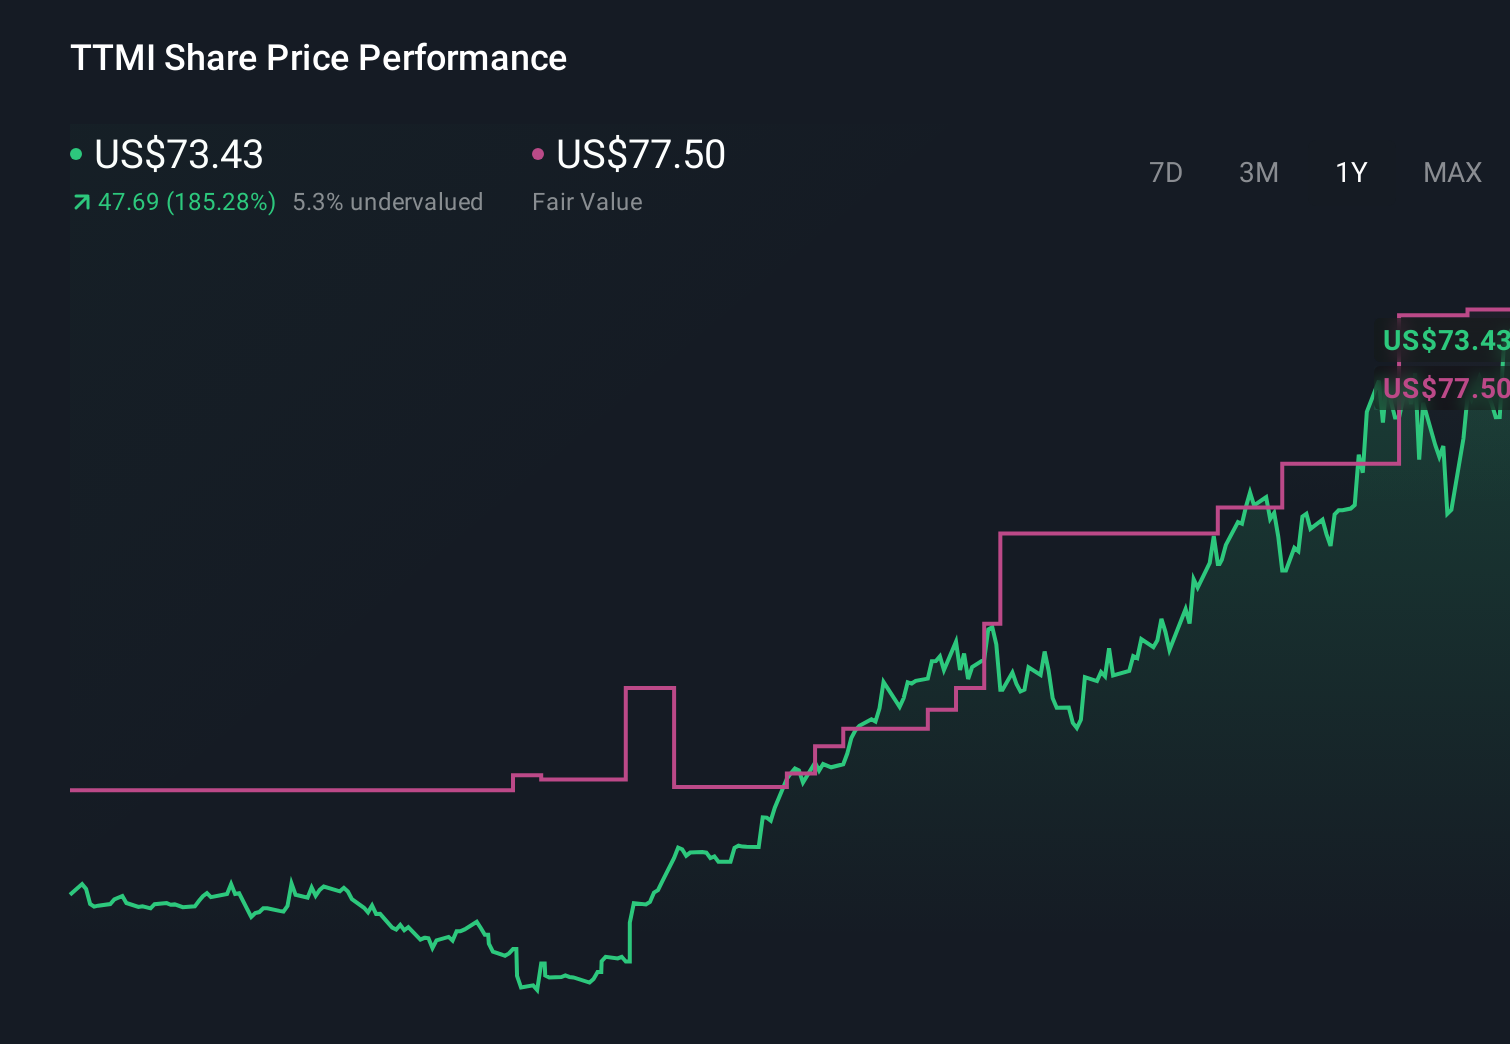
For example, one TTM Technologies Narrative might see accelerating AI and data center demand supporting a fair value near $77.50. A more cautious Narrative that focuses on execution, cost and geopolitical risks could land far lower. Comparing these different stories and values helps you choose which path you find more convincing before making a decision.
Do you think there's more to the story for TTM Technologies? Head over to our Community to see what others are saying!
This article by Simply Wall St is general in nature. We provide commentary based on historical data and analyst forecasts only using an unbiased methodology and our articles are not intended to be financial advice. It does not constitute a recommendation to buy or sell any stock, and does not take account of your objectives, or your financial situation. We aim to bring you long-term focused analysis driven by fundamental data. Note that our analysis may not factor in the latest price-sensitive company announcements or qualitative material. Simply Wall St has no position in any stocks mentioned.
Have feedback on this article? Concerned about the content? Get in touch with us directly. Alternatively, email editorial-team@simplywallst.com