
Is Smurfit Westrock’s 2024 Slide a Chance After WestRock Merger Integration Progress?
- Wondering if Smurfit Westrock is a bargain hiding in plain sight or a value trap in the making? Let us unpack what the market is really pricing in and whether the current share price makes sense.
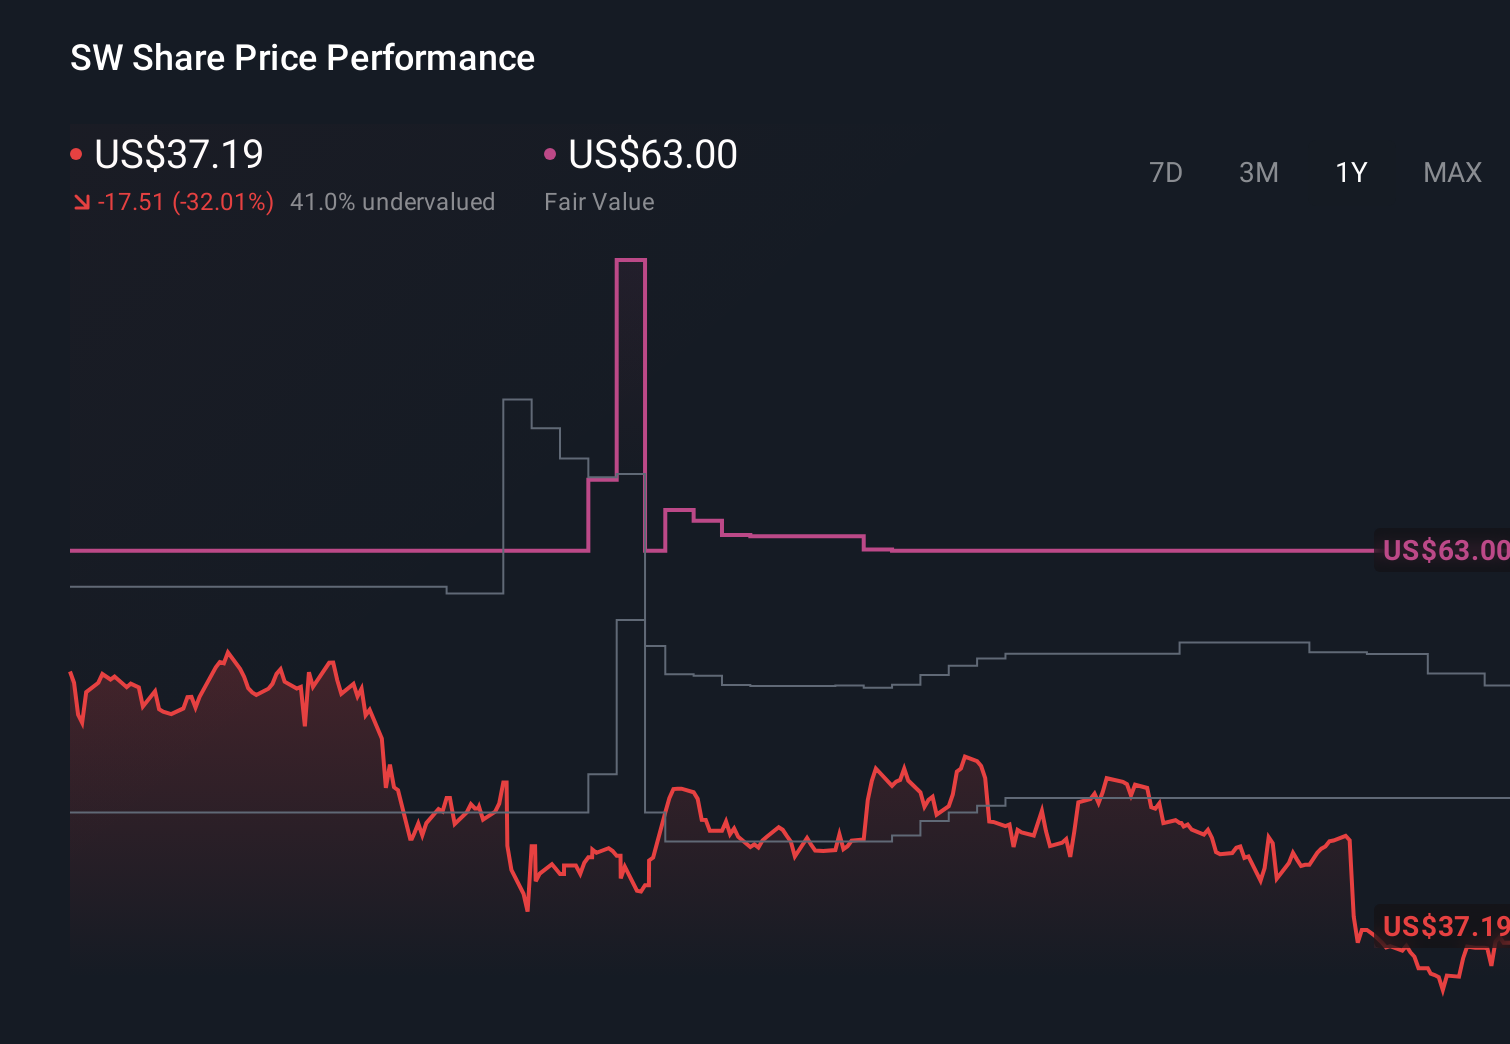
- The stock is down 2.2% over the last week and 0.5% over the past month, and it is still off 34.1% year to date and 31.3% over the last year, despite being modestly up 6.7% over three years.
- Recent headlines have focused on the ongoing integration of Smurfit Kappa and WestRock, cost synergy targets, and how the combined group plans to position itself as a global packaging leader. At the same time, investors are watching management’s comments on capital allocation and debt levels, which helps explain why the market has been reassessing both the upside potential and the risks.
- On our framework, Smurfit Westrock scores a 4 out of 6 on valuation, suggesting it screens as undervalued on most but not all checks. Next, we will walk through the main valuation methods, then finish with a more nuanced way to judge whether the current price truly reflects the company’s long term story.
Find out why Smurfit Westrock's -31.3% return over the last year is lagging behind its peers.
Approach 1: Smurfit Westrock Discounted Cash Flow (DCF) Analysis
A Discounted Cash Flow, or DCF, model estimates what a business is worth by projecting its future cash flows and discounting them back to today, using a required rate of return. For Smurfit Westrock, the model used is a 2 Stage Free Cash Flow to Equity approach, based on cash the company can generate for shareholders.
Smurfit Westrock currently produces about $763.1 Million in free cash flow, and analysts expect this to grow meaningfully over the next few years. Projections rise to around $2.6 Billion in free cash flow by 2029, with further years extrapolated by Simply Wall St to capture a full decade of cash generation.
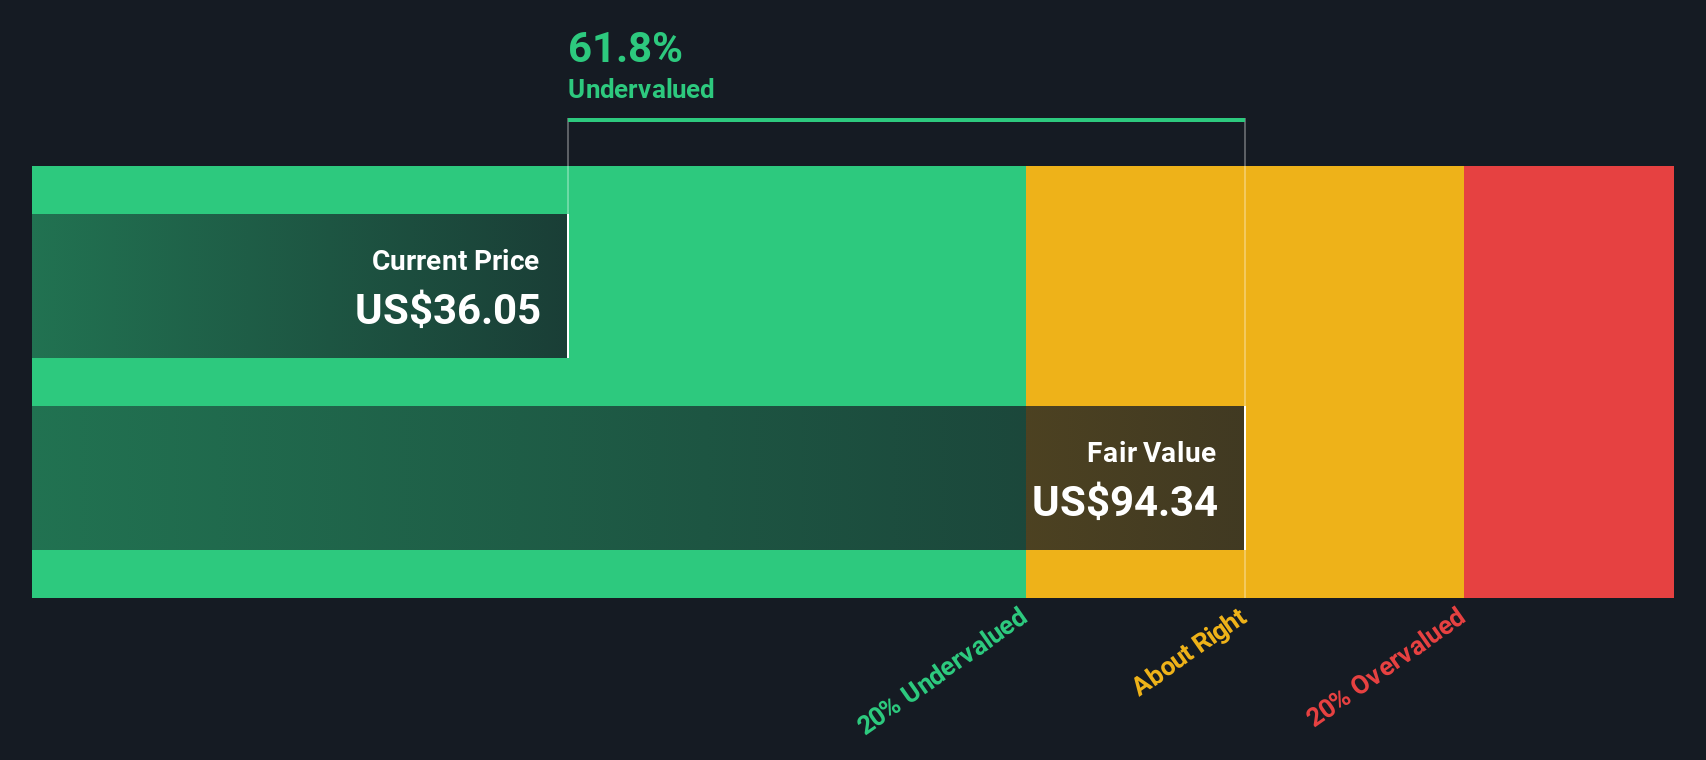
When all these forecast cash flows are discounted back to today, the model arrives at an intrinsic value of roughly $83.69 per share. Compared with the current share price, this implies the stock is about 57.8% undervalued. This indicates that the market is applying a substantial discount to the company’s long term cash generation potential.
Result: UNDERVALUED
Our Discounted Cash Flow (DCF) analysis suggests Smurfit Westrock is undervalued by 57.8%. Track this in your watchlist or portfolio, or discover 896 more undervalued stocks based on cash flows.
Approach 2: Smurfit Westrock Price vs Earnings
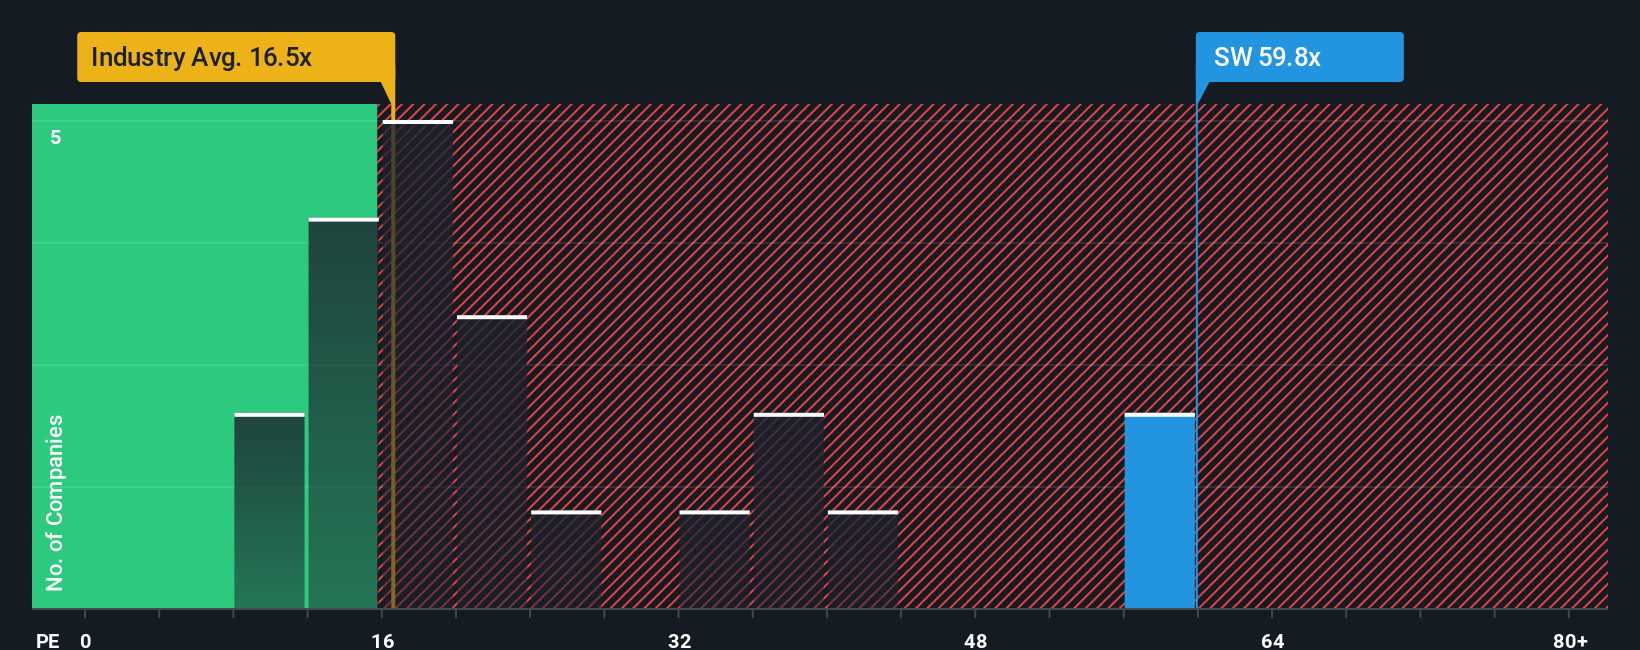
For a profitable company like Smurfit Westrock, the price to earnings, or PE, ratio is a useful way to gauge how much investors are willing to pay today for each dollar of current earnings. Higher growth and lower perceived risk usually justify a higher PE, while slower growth or elevated uncertainty tend to pull a fair PE down.
Smurfit Westrock currently trades on a PE of about 24.6x, which is noticeably above the Packaging industry average of roughly 15.4x and also higher than its peer group average of around 21.5x. On the surface, that suggests the market is already pricing in better prospects or a stronger competitive position than many rivals.
Simply Wall St’s Fair Ratio framework goes a step further by estimating what PE multiple would be reasonable for Smurfit Westrock specifically, given its earnings growth outlook, margins, risk profile, industry and market cap. This produces a Fair PE Ratio of about 28.8x, which is higher than both the current multiple and broader benchmarks, implying the stock’s quality and prospects might justify a richer valuation than the market is currently assigning.
Result: UNDERVALUED
PE ratios tell one story, but what if the real opportunity lies elsewhere? Discover 1450 companies where insiders are betting big on explosive growth.
Upgrade Your Decision Making: Choose your Smurfit Westrock Narrative
Earlier we mentioned that there is an even better way to understand valuation, so let us introduce you to Narratives, a simple way to connect your view of Smurfit Westrock’s future with a financial forecast and a fair value estimate. A Narrative is your story behind the numbers, where you set your assumptions for revenue, earnings and margins, and then see how those assumptions translate into an explicit fair value. On Simply Wall St’s Community page, millions of investors use Narratives as an easy, accessible tool to decide when to buy or sell by comparing their Fair Value to the current Price, with each Narrative automatically updating when new information like earnings or news arrives. For Smurfit Westrock, one Narrative might assume margins climb to around 6.5% with strong index inclusion and synergy benefits, supporting a fair value closer to $63 per share. A more cautious Narrative might assume only 6.1% margins and slower growth, pointing to a fair value closer to $46. The difference between those stories, and their implied upside or downside, is what really drives your investment decision.
Do you think there's more to the story for Smurfit Westrock? Head over to our Community to see what others are saying!
This article by Simply Wall St is general in nature. We provide commentary based on historical data and analyst forecasts only using an unbiased methodology and our articles are not intended to be financial advice. It does not constitute a recommendation to buy or sell any stock, and does not take account of your objectives, or your financial situation. We aim to bring you long-term focused analysis driven by fundamental data. Note that our analysis may not factor in the latest price-sensitive company announcements or qualitative material. Simply Wall St has no position in any stocks mentioned.
Have feedback on this article? Concerned about the content? Get in touch with us directly. Alternatively, email editorial-team@simplywallst.com