
Is Confluent’s Recent 27% Rally Justified by Its Data Streaming Growth Story in 2025?
- Wondering if Confluent is finally at a price that makes sense, or if the market is just getting ahead of itself? In this article, we walk through whether the current tag on this data streaming stock really stacks up against its fundamentals.
- After a choppy stretch, Confluent has bounced, with the share price up 26.4% over the last week and 27.1% over the past month, even though the 1-year return is still slightly in the red at -4.2% and the 3-year return sits at 25.7%.
- Some of this renewed interest has been driven by Confluent's ongoing push deeper into cloud native data streaming and partnerships in the broader AI and analytics ecosystem. These developments have investors rethinking its long-term growth runway. At the same time, shifting sentiment around high growth software names has put more focus on which companies can translate developer adoption into durable, scalable cash flows.
- Despite all that, Confluent only scores 1/6 on our undervaluation checks. In the next sections, we unpack what different valuation approaches say about the stock today, then finish with a more nuanced way to judge whether the current price reflects its long-term potential.
Confluent scores just 1/6 on our valuation checks. See what other red flags we found in the full valuation breakdown.
Approach 1: Confluent Discounted Cash Flow (DCF) Analysis
A Discounted Cash Flow model estimates what a business is worth by projecting its future cash flows and discounting them back to today in $ terms. For Confluent, the 2 Stage Free Cash Flow to Equity model starts with last twelve months free cash flow of about $30 million and then layers on analyst forecasts and longer term assumptions.
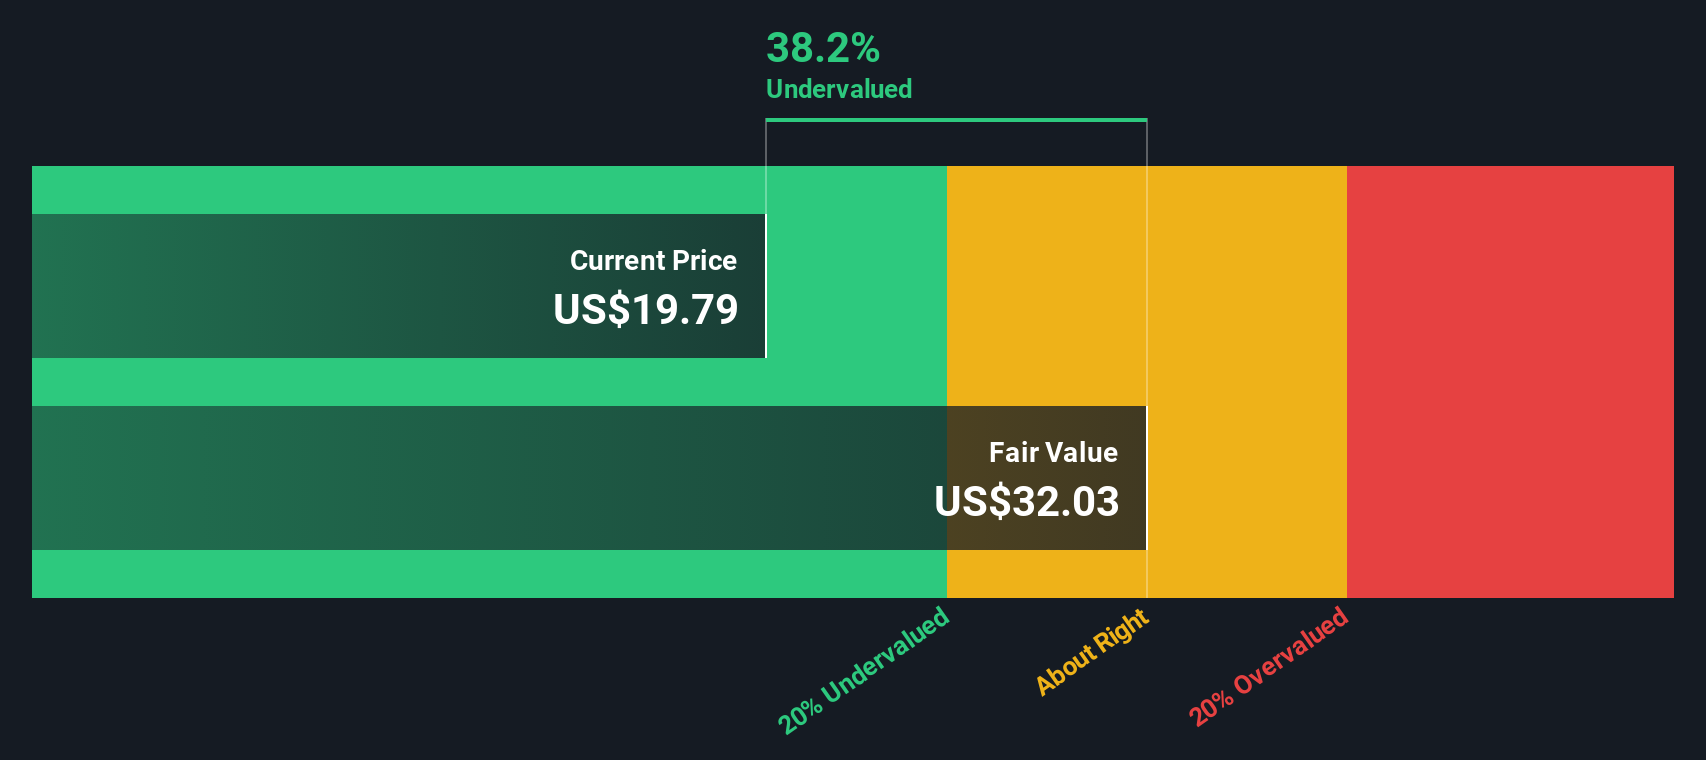
Analysts expect free cash flow to ramp quickly, with projections of roughly $181.6 million by 2027 and $454.3 million by 2029. Beyond the formal forecast horizon, Simply Wall St extrapolates the trend, with modeled free cash flow reaching just over $1.0 billion by 2035. Rolling these cash flows back to today, the model arrives at an intrinsic value of about $34.17 per share.
This implies the shares trade at a 12.5% discount to that DCF fair value. This suggests the market is not fully pricing in the growth embedded in these projections, but the gap is not extreme either.
Result: UNDERVALUED
Our Discounted Cash Flow (DCF) analysis suggests Confluent is undervalued by 12.5%. Track this in your watchlist or portfolio, or discover 896 more undervalued stocks based on cash flows.
Approach 2: Confluent Price vs Sales
For a fast growing software business that is still moving toward consistent profitability, the price to sales ratio is often a more useful yardstick than earnings based metrics. It lets us compare what investors are paying today for each dollar of current revenue, while acknowledging that margins should improve over time as the model scales.
What counts as a fair multiple depends on how quickly those sales are expected to grow and how risky the path to profitability looks. Higher growth and clearer visibility to strong margins usually justify a higher price to sales ratio, while more uncertainty or weaker unit economics argue for a lower one.
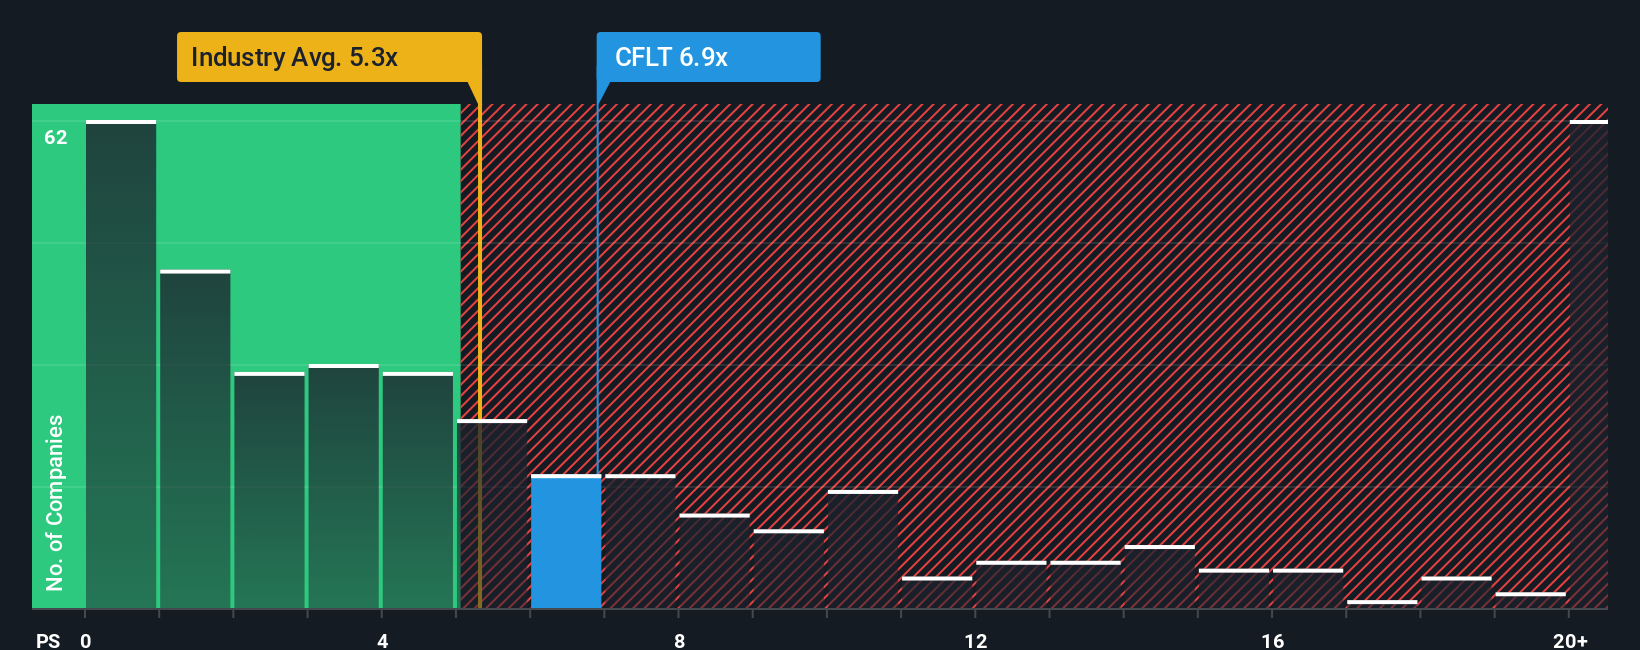
Confluent currently trades at about 9.40x sales, which is well above the broader Software industry average of roughly 4.95x and also ahead of a peer group average of around 8.84x. Simply Wall St’s Fair Ratio framework takes this comparison a step further by estimating what a justified multiple should be, based on factors like Confluent’s growth profile, profitability trajectory, risk, industry and market cap. On this basis, the model suggests a Fair Ratio of 7.56x. This implies the stock screens as somewhat expensive on revenue.
Result: OVERVALUED
PS ratios tell one story, but what if the real opportunity lies elsewhere? Discover 1450 companies where insiders are betting big on explosive growth.
Upgrade Your Decision Making: Choose your Confluent Narrative
Earlier we mentioned that there is an even better way to understand valuation, so let's introduce you to Narratives, a simple way to attach your own story about Confluent to the numbers you think are reasonable for its future revenue, earnings, margins and fair value.
A Narrative connects three things in a straight line: what you believe about the business, how that belief flows into a financial forecast, and the fair value that drops out of that forecast, so you can clearly see whether your story really supports the price you are paying.
On Simply Wall St, Narratives live inside the Community page and are used by millions of investors as an easy tool to turn their views into numbers, compare their Fair Value to the latest share Price, and decide whether they see Confluent as a buy, hold or sell.
Because Narratives are updated dynamically as new information, like quarterly earnings or major news on AI products and potential acquisitions, flows in, they stay relevant and can capture very different perspectives. These range from investors who think Confluent deserves a higher fair value closer to $36 on strong real time AI adoption and partner momentum, through to more cautious investors who anchor nearer $20 because of competitive risk and uncertainty around long term cloud growth.
Do you think there's more to the story for Confluent? Head over to our Community to see what others are saying!

This article by Simply Wall St is general in nature. We provide commentary based on historical data and analyst forecasts only using an unbiased methodology and our articles are not intended to be financial advice. It does not constitute a recommendation to buy or sell any stock, and does not take account of your objectives, or your financial situation. We aim to bring you long-term focused analysis driven by fundamental data. Note that our analysis may not factor in the latest price-sensitive company announcements or qualitative material. Simply Wall St has no position in any stocks mentioned.
Have feedback on this article? Concerned about the content? Get in touch with us directly. Alternatively, email editorial-team@simplywallst.com