
Graham Holdings (GHC): Rethinking Valuation After Recent Share Price Pullback and Strong Earnings Growth
Graham Holdings (GHC) has quietly pulled back over the past month even after delivering steady revenue growth and strong multi year returns, which sets up an interesting moment for long term investors.
See our latest analysis for Graham Holdings.
At around $1,081.58 per share, Graham Holdings has given back some ground in recent weeks, but that follows a robust year to date share price return and especially impressive multi year total shareholder returns, suggesting momentum is pausing rather than breaking.
If Graham’s steady long term wealth creation has you thinking more broadly about quality compounders, it could be a good moment to explore fast growing stocks with high insider ownership.
With the shares trading above analyst targets but backed by resilient, cash generative operations, investors now face a pivotal question: Is Graham Holdings quietly undervalued, or has the market already priced in its next chapter of growth?
Price-to-Earnings of 6.5x: Is it justified?
On a headline basis, Graham Holdings looks inexpensive, trading on a price-to-earnings ratio of 6.5x against a last close of $1,081.58. This points to undervaluation versus the broader market and its peers.
The price-to-earnings multiple compares the current share price to the company’s earnings per share. It is a direct gauge of how much investors are paying for each dollar of profit. For a diversified, cash generating group with a long operating history, this is a particularly relevant yardstick because earnings quality and consistency matter as much as top line growth.
Relative to the US market average of 18.6x and the Consumer Services industry average of 15.6x, Graham Holdings’ 6.5x multiple implies the market is heavily discounting its earnings power. This is despite evidence of high quality earnings and a sharp 218% jump in profits over the past year. When peers are valued at more than double this level on average, it suggests investors may not be fully recognizing the company’s earnings trajectory or the resilience of its diversified portfolio.
See what the numbers say about this price — find out in our valuation breakdown.
Result: Price-to-Earnings of 6.5x (UNDERVALUED)
However, investors should weigh Graham’s sprawling, acquisition driven portfolio and recent share price outperformance, since operational missteps or multiple compression could quickly challenge the undervaluation case.
Find out about the key risks to this Graham Holdings narrative.
Another Lens on Value
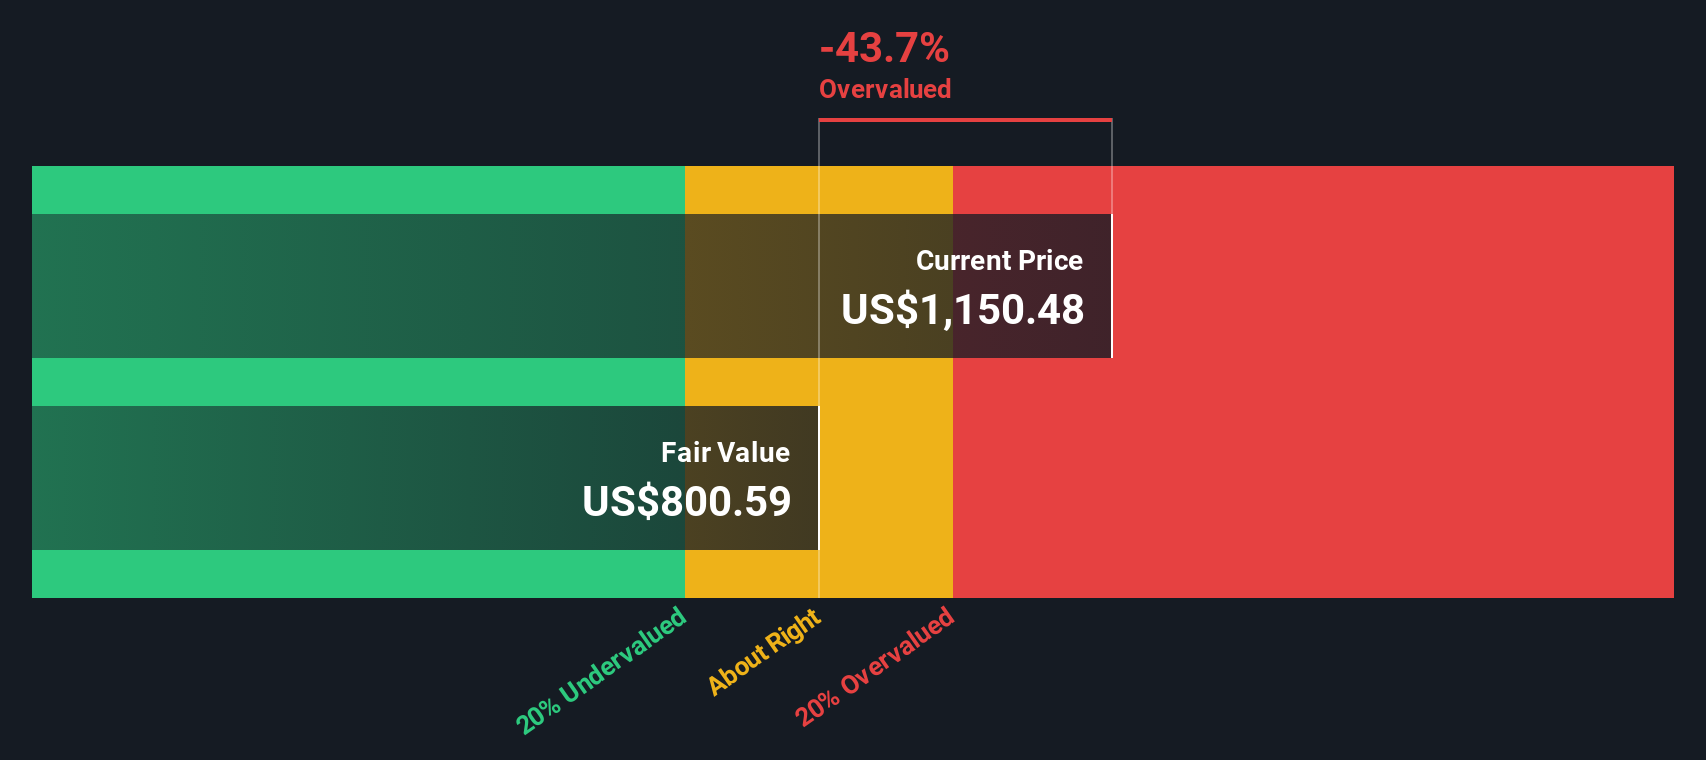
Our DCF model paints a different picture, suggesting Graham Holdings, at $1,081.58, is trading slightly above its fair value estimate of $1,064.59. That leans toward modest overvaluation. Are investors now paying a premium for consistency and quality rather than clear upside?
Look into how the SWS DCF model arrives at its fair value.
Simply Wall St performs a discounted cash flow (DCF) on every stock in the world every day (check out Graham Holdings for example). We show the entire calculation in full. You can track the result in your watchlist or portfolio and be alerted when this changes, or use our stock screener to discover 896 undervalued stocks based on their cash flows. If you save a screener we even alert you when new companies match - so you never miss a potential opportunity.
Build Your Own Graham Holdings Narrative
If you see the story differently or want to stress test these assumptions with your own inputs, you can craft a personalized view in minutes at Do it your way.
A good starting point is our analysis highlighting 2 key rewards investors are optimistic about regarding Graham Holdings.
Looking for more investment ideas?
If you stop with Graham Holdings, you could miss other powerful opportunities. Let us help you pinpoint fresh ideas tailored to your investing edge.
- Capture high potential growth and volatility by targeting under the radar opportunities through these 3591 penny stocks with strong financials that combine compelling stories with improving fundamentals.
- Capitalize on the surge in intelligent automation by focusing on these 27 AI penny stocks that are reshaping industries with scalable software and data driven platforms.
- Secure steadier portfolio income by zeroing in on these 15 dividend stocks with yields > 3% that aim to balance reliable payouts with sustainable business models.
This article by Simply Wall St is general in nature. We provide commentary based on historical data and analyst forecasts only using an unbiased methodology and our articles are not intended to be financial advice. It does not constitute a recommendation to buy or sell any stock, and does not take account of your objectives, or your financial situation. We aim to bring you long-term focused analysis driven by fundamental data. Note that our analysis may not factor in the latest price-sensitive company announcements or qualitative material. Simply Wall St has no position in any stocks mentioned.
Have feedback on this article? Concerned about the content? Get in touch with us directly. Alternatively, email editorial-team@simplywallst.com