
Has L1 Group’s 46.8% 2025 Rally Left Limited Upside?
- If you are wondering whether L1 Group is still worth a closer look after its recent run, or if the easy gains are already gone, you are in the right place to unpack what the current share price really implies.
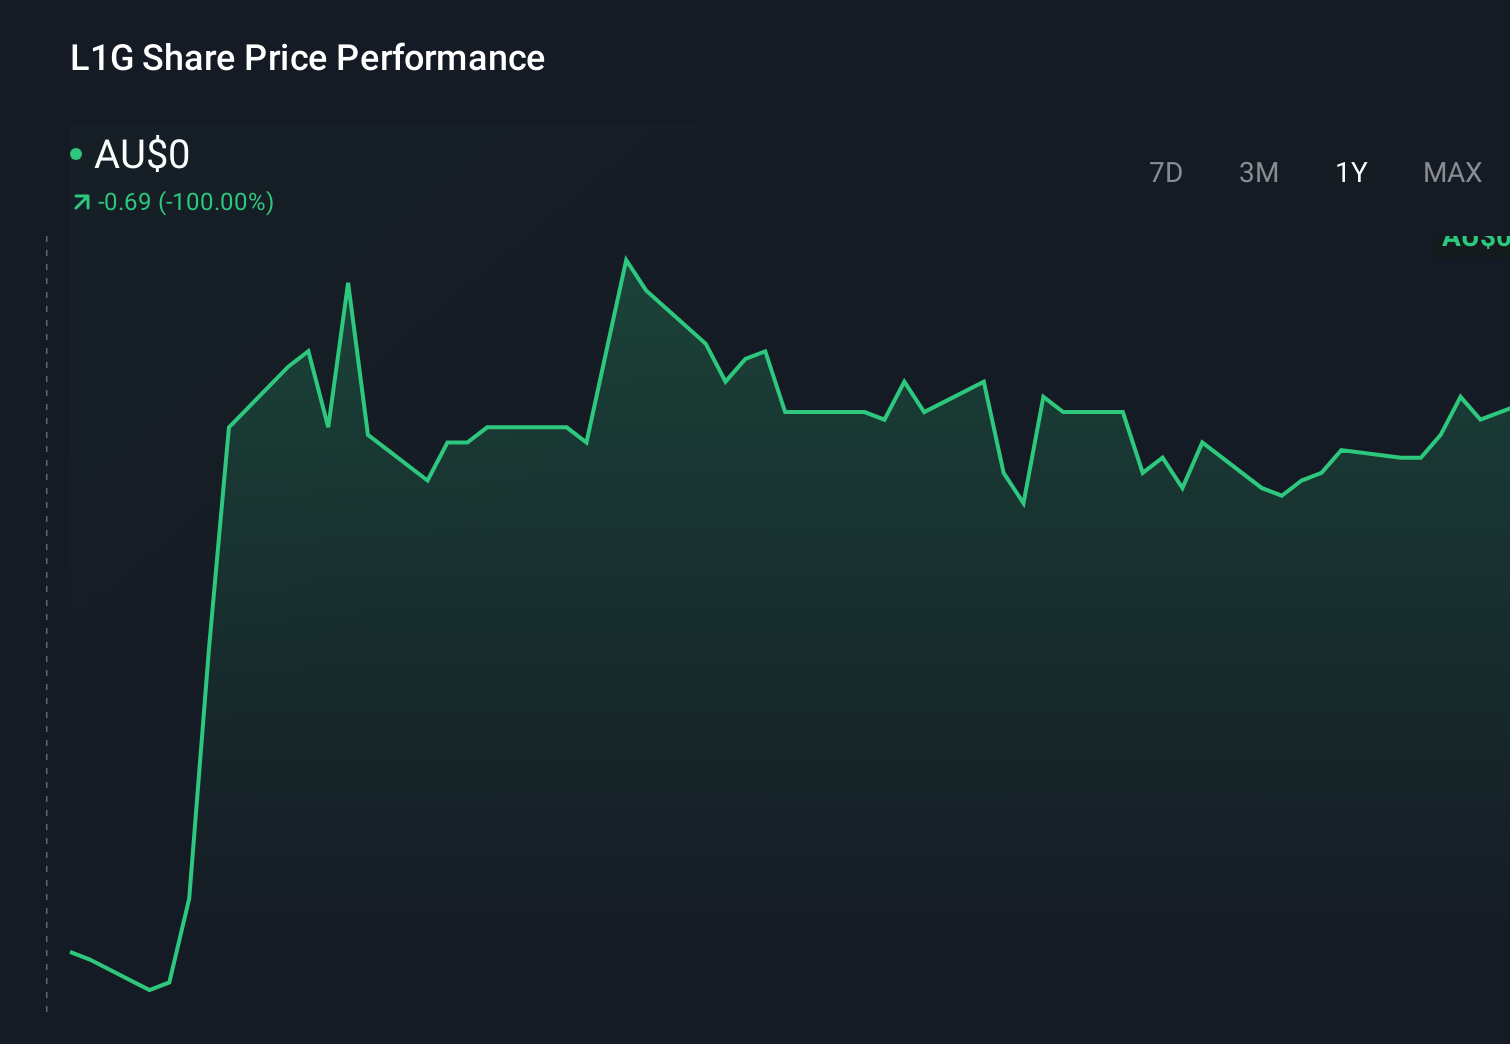
- The stock has climbed 46.8% year to date, even though it has dipped 2.9% over the last month and gained a modest 2.5% in the past week. This pattern often signals that investors are rethinking both its growth potential and risk profile.
- Recent coverage has highlighted L1 Group’s position in the diversified financials space as investors search for ASX names that can benefit from shifting market conditions and more active capital allocation. At the same time, the stock has started to appear more often on value and momentum screens, suggesting that institutions and retail investors alike are beginning to pay closer attention.
- Despite that renewed interest, L1 Group currently scores just 1 out of 6 on our valuation checks. This means it only looks undervalued on one of the six measures we track. Next we will walk through those methods in detail, before finishing with a more holistic way to think about what the stock is really worth.
L1 Group scores just 1/6 on our valuation checks. See what other red flags we found in the full valuation breakdown.
Approach 1: L1 Group Discounted Cash Flow (DCF) Analysis
A Discounted Cash Flow model estimates what a company is worth by projecting its future cash flows and then discounting those sums back to today, using a rate that reflects risk and the time value of money.
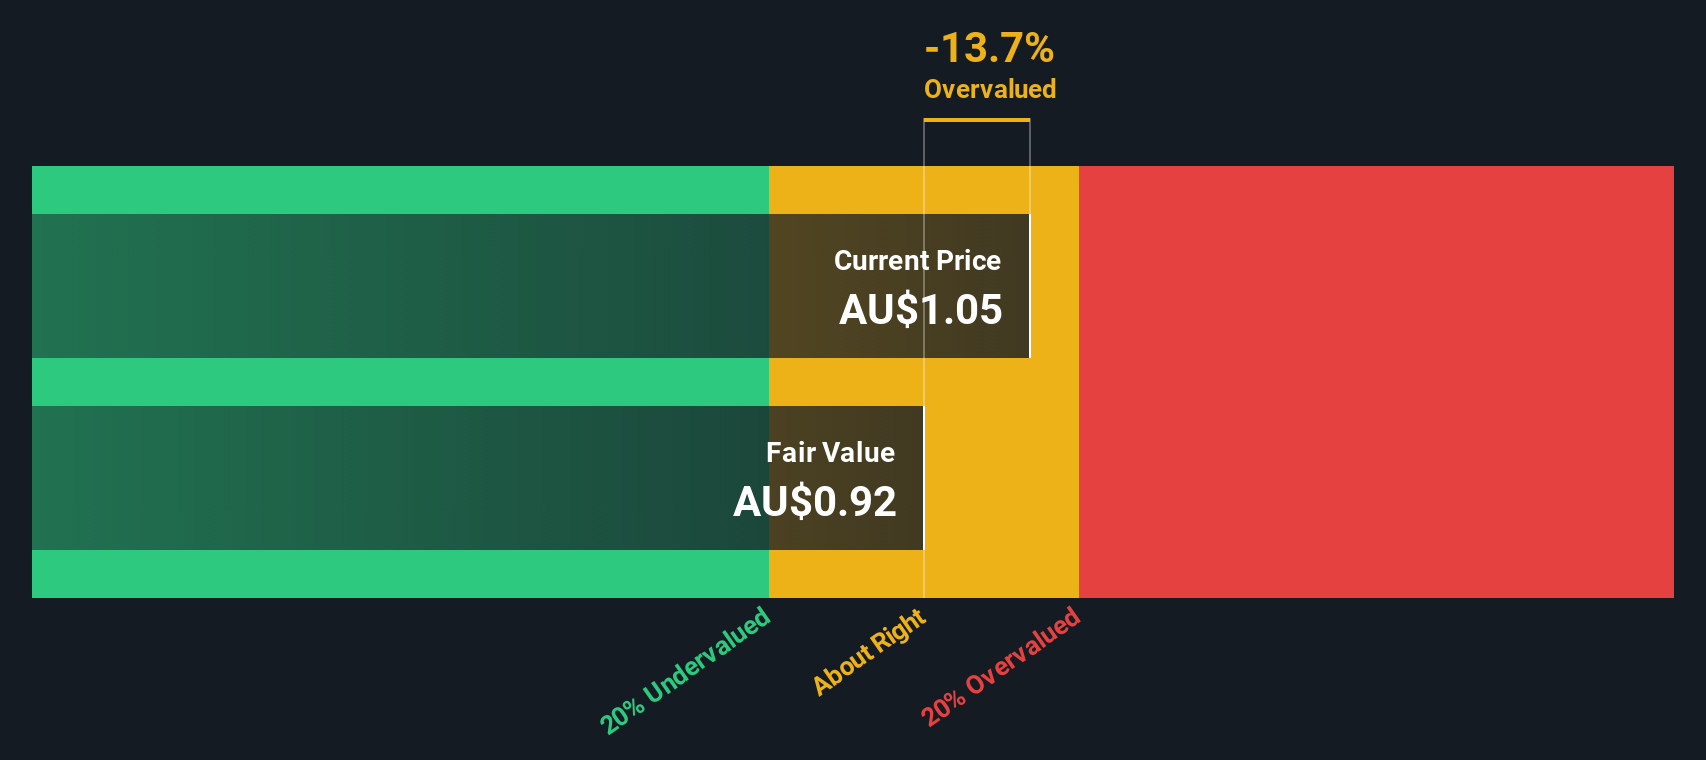
For L1 Group, the 2 Stage Free Cash Flow to Equity model uses analyst forecasts for the next few years, then extrapolates further out. These projections show free cash flow turning positive and scaling up, with A$115.88 Million expected by FY 2029, and continuing to grow through to 2035 based on Simply Wall St extrapolations. All figures are calculated in A$, the company’s reporting currency. Despite this improving cash flow profile, the model suggests that when these future A$ cash flows are discounted back to today, the present value works out to about A$0.92 per share.
This intrinsic value implies the stock is roughly 11.1% overvalued relative to its current share price. On a pure cash flow basis the recent rally appears to have pushed L1 Group a little ahead of its fundamentals.
Result: OVERVALUED
Our Discounted Cash Flow (DCF) analysis suggests L1 Group may be overvalued by 11.1%. Discover 895 undervalued stocks or create your own screener to find better value opportunities.
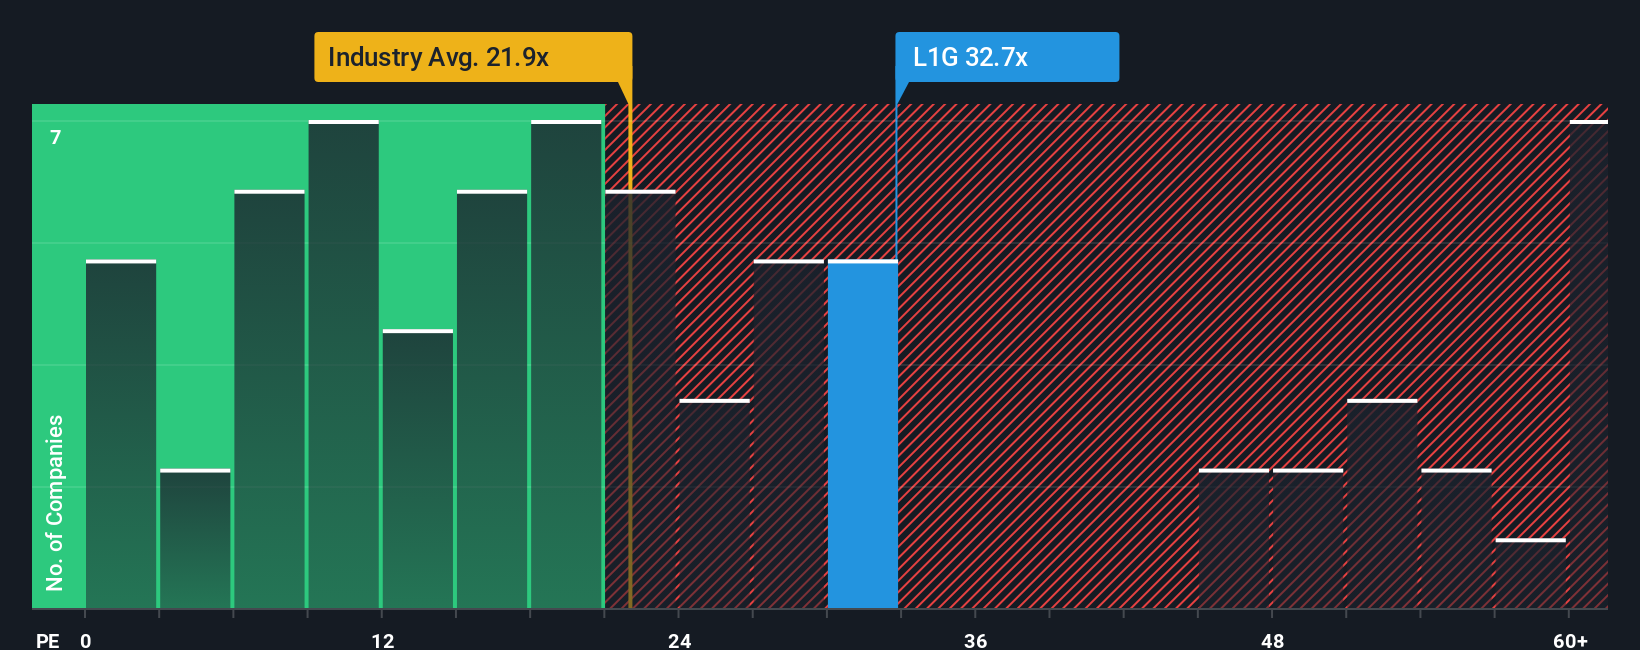
Approach 2: L1 Group Price vs Earnings
For a profitable company like L1 Group, the price to earnings ratio is a useful way to gauge what investors are willing to pay today for each dollar of current profits. It ties the valuation directly to the bottom line, which tends to be more stable and comparable across businesses than revenue or balance sheet values.
What counts as a reasonable PE depends on how quickly earnings are expected to grow and how risky those earnings are. Higher growth and lower risk can justify a richer multiple, while slower growth or more volatility usually call for a discount. L1 Group currently trades on about 31.95x earnings, which is above the Capital Markets industry average of roughly 20.60x but below the peer group average near 67.72x. On the surface, that suggests investors are paying a premium to the sector, but not an extreme one versus faster growing or more speculative names.
Simply Wall St also applies a proprietary Fair Ratio, which estimates what a justified PE should be based on L1 Group’s earnings growth outlook, profitability, risk profile, industry and market cap. This tailored benchmark is more informative than broad peer or industry comparisons because it adjusts for company specific strengths and weaknesses rather than assuming all Capital Markets businesses deserve the same multiple. Comparing L1 Group’s actual PE of 31.95x with its Fair Ratio points to the shares trading somewhat ahead of what those fundamentals would usually support.
Result: OVERVALUED
PE ratios tell one story, but what if the real opportunity lies elsewhere? Discover 1450 companies where insiders are betting big on explosive growth.
Upgrade Your Decision Making: Choose your L1 Group Narrative
Earlier we mentioned that there is an even better way to understand valuation, so let us introduce you to Narratives. A Narrative is simply your story about a company, expressed through numbers like your own fair value estimate, and assumptions about future revenue, earnings and margins. Instead of relying only on broad multiples or analyst models, Narratives connect three pieces together in a clear line: the company’s story, a financial forecast, and a resulting fair value. On Simply Wall St, millions of investors build and share Narratives on the Community page, making this approach accessible even if you are not a valuation expert. Narratives can help you decide what to do by comparing your Fair Value to the current share price, and they update dynamically as new information such as earnings releases, guidance changes or major news is incorporated. For example, one L1 Group Narrative might assume higher long term asset growth and assign a much higher fair value, while another might assume slower growth and thinner margins, leading to a far lower fair value and a more cautious stance.
Do you think there's more to the story for L1 Group? Head over to our Community to see what others are saying!
This article by Simply Wall St is general in nature. We provide commentary based on historical data and analyst forecasts only using an unbiased methodology and our articles are not intended to be financial advice. It does not constitute a recommendation to buy or sell any stock, and does not take account of your objectives, or your financial situation. We aim to bring you long-term focused analysis driven by fundamental data. Note that our analysis may not factor in the latest price-sensitive company announcements or qualitative material. Simply Wall St has no position in any stocks mentioned.
Have feedback on this article? Concerned about the content? Get in touch with us directly. Alternatively, email editorial-team@simplywallst.com