
Has IAMGOLD’s 162% 2025 Rally Already Priced In Its Cash Flow Recovery?
- If you are wondering whether IAMGOLD has already run too far or if there is still value on the table, you are not alone. This is exactly what we are going to unpack.
- With the share price up 12.8% over the last month, 162.1% year to date, and 664.4% over three years, the market has clearly re-rated the stock and is now pricing in a very different future than it did a few years ago.
- That surge has been fueled by a stronger gold price backdrop and progress at IAMGOLD's key development projects, which has shifted investor focus from survival to growth. In particular, updates around production ramp up and balance sheet de-risking have helped rebuild confidence in the company as a leveraged play on gold.
- Even after this run, IAMGOLD scores a 4/6 valuation check rating. This means it still screens as undervalued on most of our metrics. Next we will walk through the key valuation approaches, before finishing with another way to think about what the market is really willing to pay for IAMGOLD.
Approach 1: IAMGOLD Discounted Cash Flow (DCF) Analysis
A Discounted Cash Flow, or DCF, model estimates what a company is worth today by projecting the cash it will generate in the future and discounting those cash flows back to a present value.
For IAMGOLD, the latest twelve month free cash flow is negative at around $457.5 Million. This reflects heavy investment and ramp up rather than mature, steady cash generation. Analysts expect this to change significantly, with free cash flow projected to be about $1.43 Billion by 2028. Beyond the formal analyst window, Simply Wall St extrapolates further cash flows through to 2035 using a 2 Stage Free Cash Flow to Equity model, gradually tapering growth as the business matures.
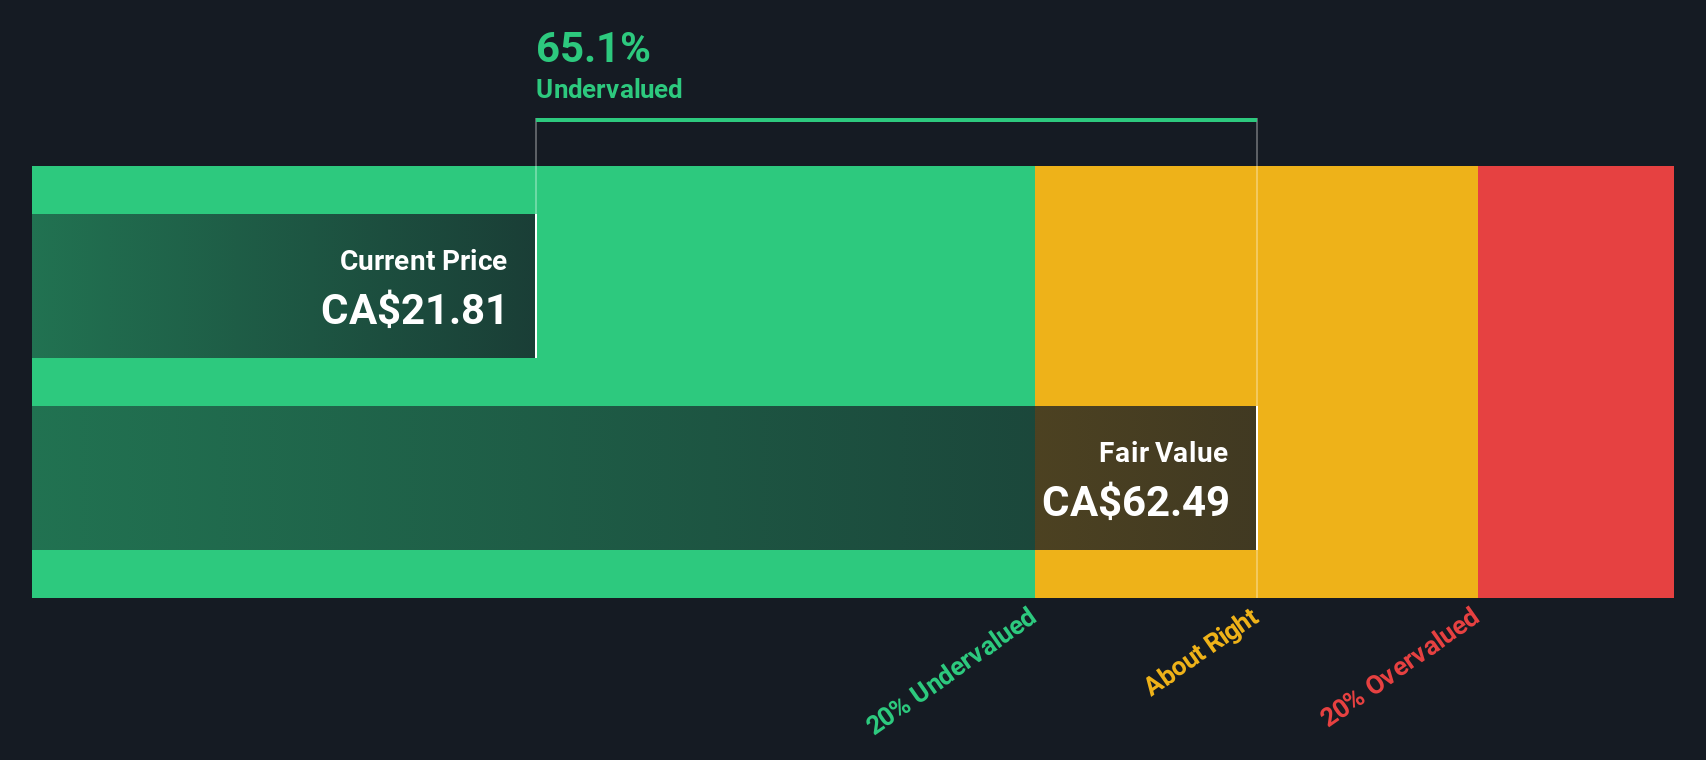
When all of those future cash flows are discounted back to today, the model arrives at an intrinsic value of roughly $66.12 per share. Compared with the current share price, this implies the stock is about 68.2% undervalued on a cash flow basis. This suggests the market is still skeptical that IAMGOLD will fully deliver on these projections.
Result: UNDERVALUED
Our Discounted Cash Flow (DCF) analysis suggests IAMGOLD is undervalued by 68.2%. Track this in your watchlist or portfolio, or discover 895 more undervalued stocks based on cash flows.
Approach 2: IAMGOLD Price vs Earnings
For a company that is generating positive earnings, the price to earnings, or PE, ratio is often the cleanest way to gauge what investors are willing to pay for each dollar of profit. It naturally reflects expectations for future growth and the level of risk, with faster growing or lower risk businesses usually justifying a higher PE multiple, while slower or riskier names tend to trade on lower ratios.
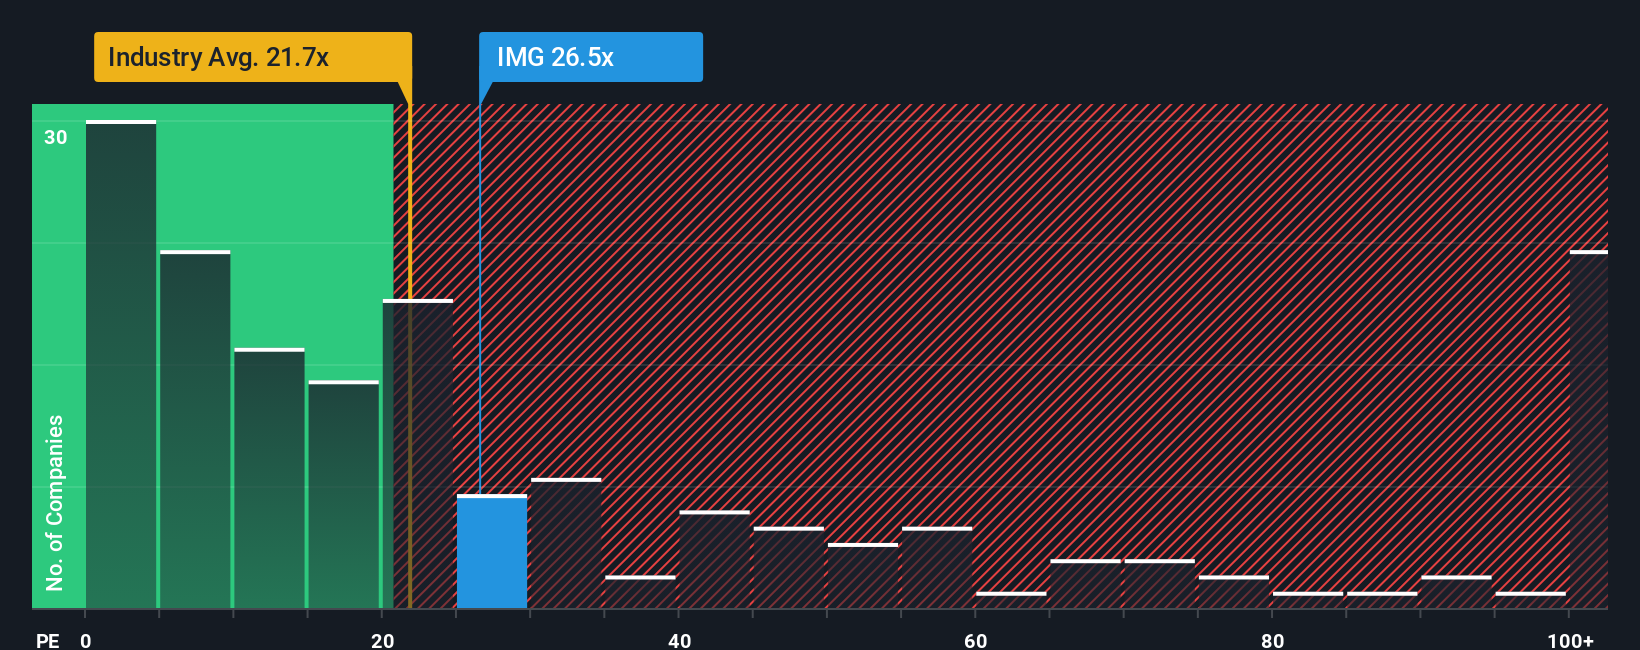
IAMGOLD currently trades on about 25.4x earnings. That sits above the broader Metals and Mining industry average of roughly 21.2x, but well below the 62.6x average of its closest peers. To sharpen this view, Simply Wall St uses a proprietary Fair Ratio, which estimates what a reasonable PE should be for IAMGOLD given its specific growth outlook, profitability profile, industry, size and risk factors. In this case, the Fair Ratio is 27.2x, slightly above the current market multiple. Because this metric is tailored to IAMGOLD, it offers a more nuanced signal than blunt comparisons to peers or the sector alone. On this basis, the shares still appear modestly undervalued.
Result: UNDERVALUED
PE ratios tell one story, but what if the real opportunity lies elsewhere? Discover 1450 companies where insiders are betting big on explosive growth.
Upgrade Your Decision Making: Choose your IAMGOLD Narrative
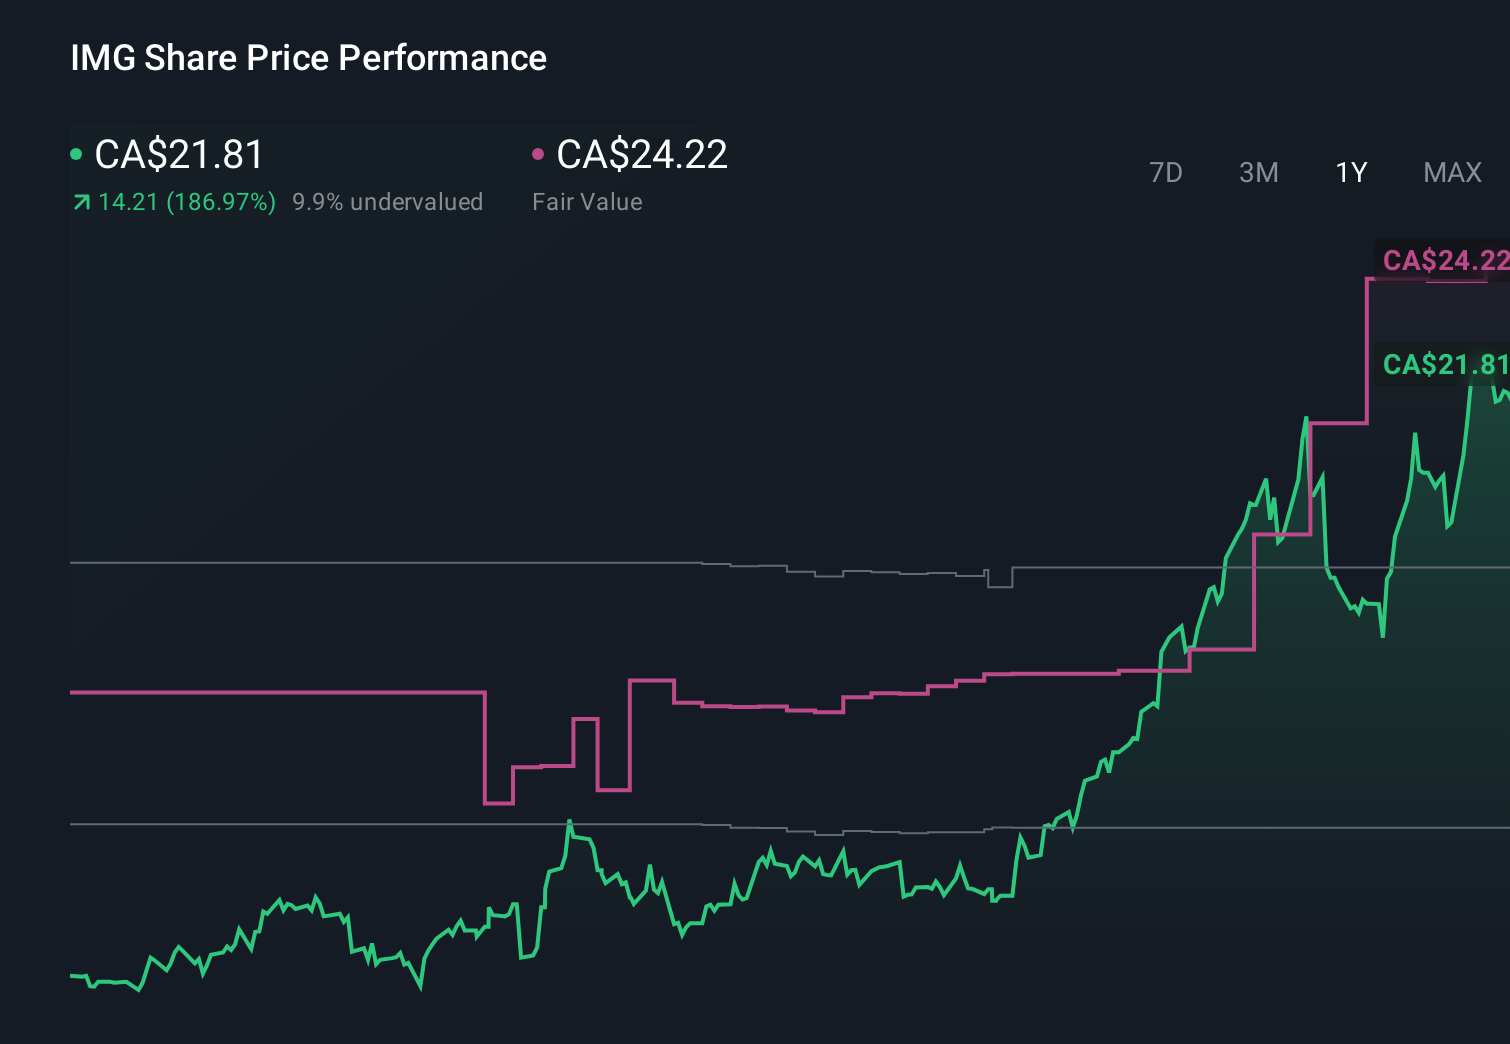
Earlier we mentioned that there is an even better way to understand valuation, so let us introduce you to Narratives, a simple way to connect your view of IAMGOLD’s story with the numbers behind its future. A Narrative is your own explained perspective on the company, where you spell out how you think revenue, earnings and margins will evolve and then link that story to a financial forecast and a fair value estimate. On Simply Wall St’s Community page, used by millions of investors, Narratives are an easy, guided tool that help you turn beliefs like stronger gold production, better cost control or higher risk into concrete projections. Once you have a Narrative, the platform compares your Fair Value to the current share price and helps you consider whether IAMGOLD looks like a buy, hold or sell, and it automatically updates your view as new news, earnings or guidance come in. For IAMGOLD, one Narrative might assume robust resource expansion and buybacks that justify a fair value near CA$24.22, while a more cautious Narrative could focus on operational and geopolitical risks and land closer to CA$10.99.
Do you think there's more to the story for IAMGOLD? Head over to our Community to see what others are saying!
This article by Simply Wall St is general in nature. We provide commentary based on historical data and analyst forecasts only using an unbiased methodology and our articles are not intended to be financial advice. It does not constitute a recommendation to buy or sell any stock, and does not take account of your objectives, or your financial situation. We aim to bring you long-term focused analysis driven by fundamental data. Note that our analysis may not factor in the latest price-sensitive company announcements or qualitative material. Simply Wall St has no position in any stocks mentioned.
Have feedback on this article? Concerned about the content? Get in touch with us directly. Alternatively, email editorial-team@simplywallst.com