
Assessing Applied Materials After a 63% 2025 Rally and Strong AI Driven Demand
- Wondering if Applied Materials is still a smart buy after such a big run, or if you would be catching it at the top? In this piece we will unpack what the market might be pricing in and whether that lines up with the company’s fundamentals.
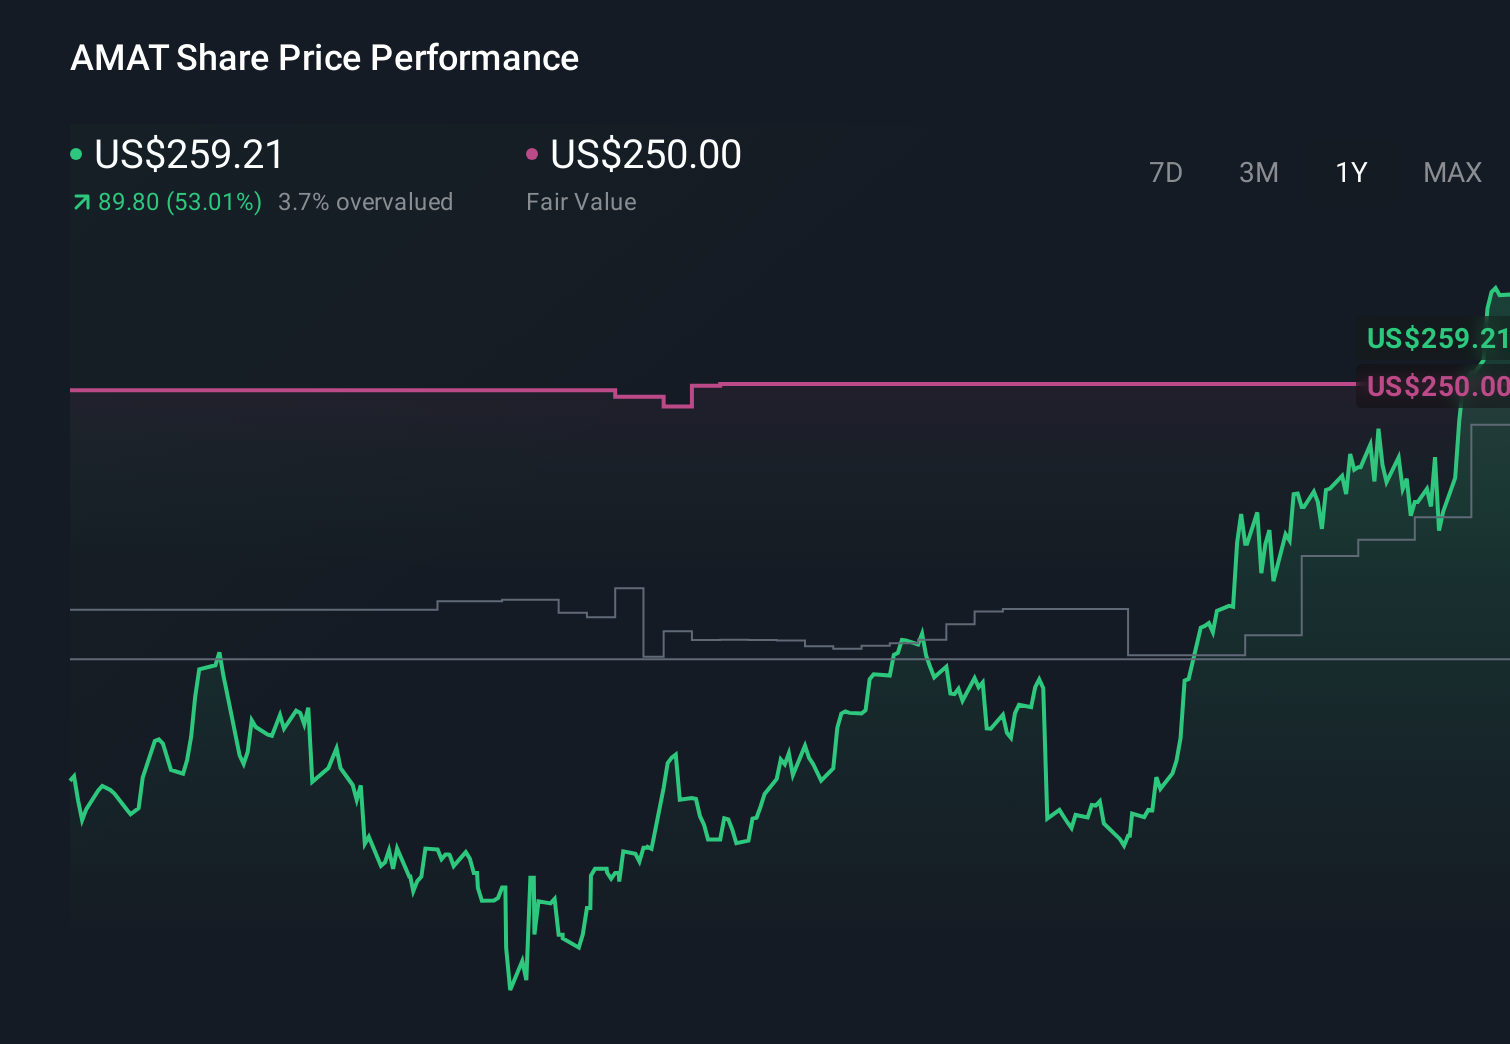
- The stock has cooled slightly over the last week, down 0.6%, but that comes after a strong 13.6% gain over the past month and a 63.0% return year to date, with 1 year and 3 year gains of 57.7% and 150.3% respectively, and 215.0% over 5 years.
- Recently, investors have been watching Applied Materials closely as chip makers ramp up spending on advanced manufacturing tools and governments keep pushing for domestic semiconductor capacity. Both trends directly support demand for the company’s equipment. At the same time, ongoing headlines about AI infrastructure build outs and long term wafer fab expansion plans have helped frame the stock as a key way to gain exposure to the broader semiconductor cycle.
- Right now, Applied Materials scores just 2/6 on our valuation checks, which suggests the market may be pricing in a lot of optimism. However, not all valuation methods tell the same story, so next we will break down multiples, cash flow based models, and comparables, before closing with a more intuitive way to think about what this valuation really implies for future returns.
Applied Materials scores just 2/6 on our valuation checks. See what other red flags we found in the full valuation breakdown.
Approach 1: Applied Materials Discounted Cash Flow (DCF) Analysis
A Discounted Cash Flow model estimates what a company is worth by projecting the cash it can generate in the future and discounting those cash flows back to today in dollar terms.
Applied Materials currently generates around $6.4 billion in free cash flow, and analysts, combined with Simply Wall St extrapolations, see this rising steadily over the coming decade. For example, forecast free cash flow climbs to about $5.7 billion in 2026 and is projected to exceed $10.2 billion by 2030, with further growth assumed through 2035 using a 2 Stage Free Cash Flow to Equity framework.
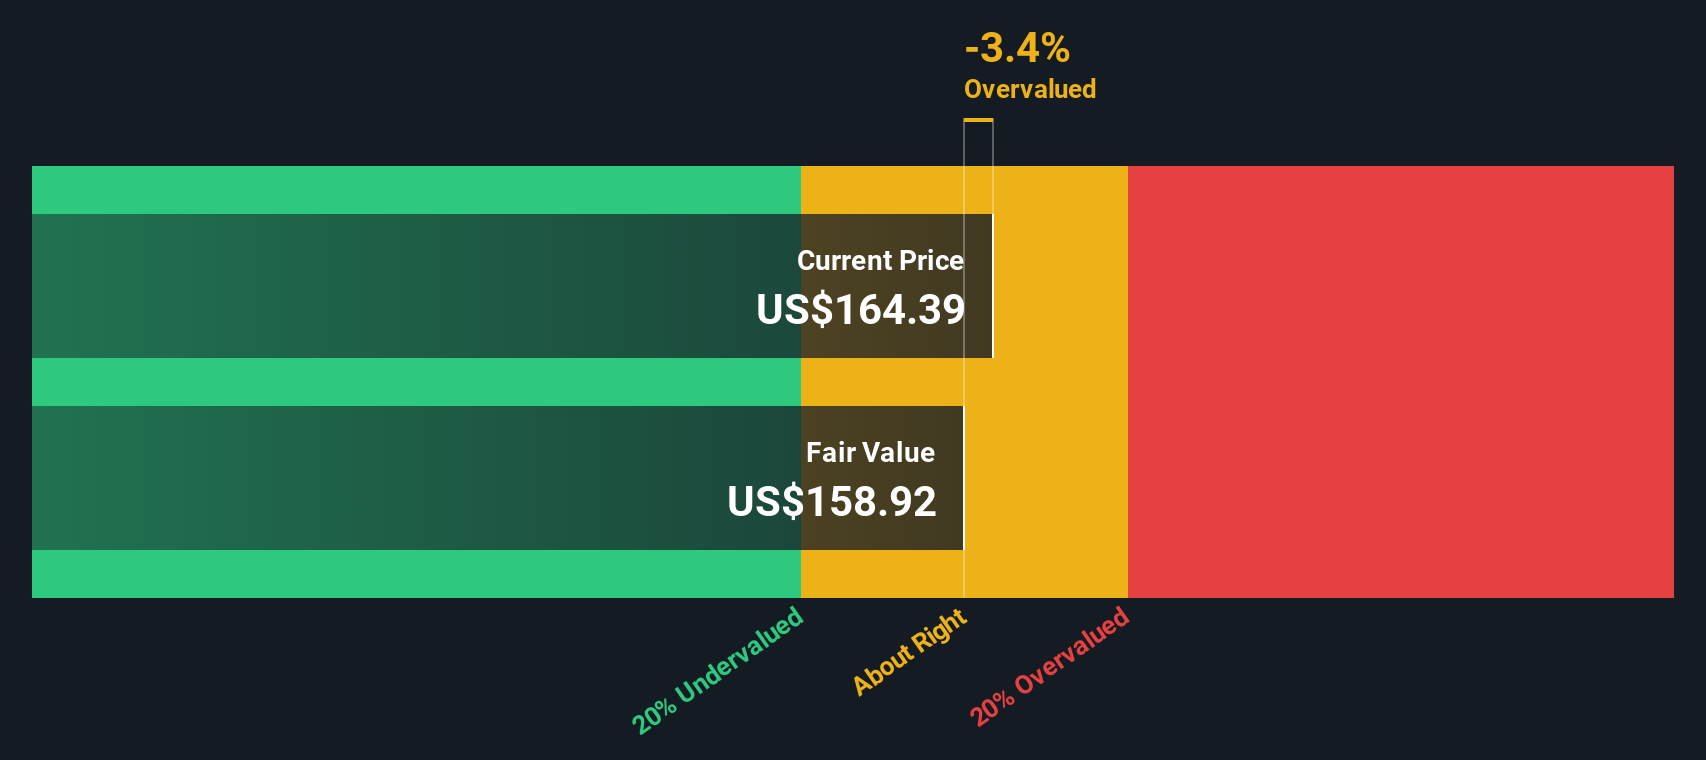
When all those future cash flows are discounted back, the model suggests an intrinsic value of roughly $157 per share. That implies the stock is about 69.7% above its DCF based fair value today, so on this framework the market appears to be pricing in far more optimistic cash flow growth than the model assumes.
Result: OVERVALUED
Our Discounted Cash Flow (DCF) analysis suggests Applied Materials may be overvalued by 69.7%. Discover 895 undervalued stocks or create your own screener to find better value opportunities.
Approach 2: Applied Materials Price vs Earnings
For a profitable, relatively mature business like Applied Materials, the price to earnings ratio is a useful way to judge valuation because it links what investors pay today to the company’s current profit stream. A higher PE can be justified when investors expect stronger growth and see less risk, while slower growth or higher uncertainty usually calls for a lower, more conservative PE.
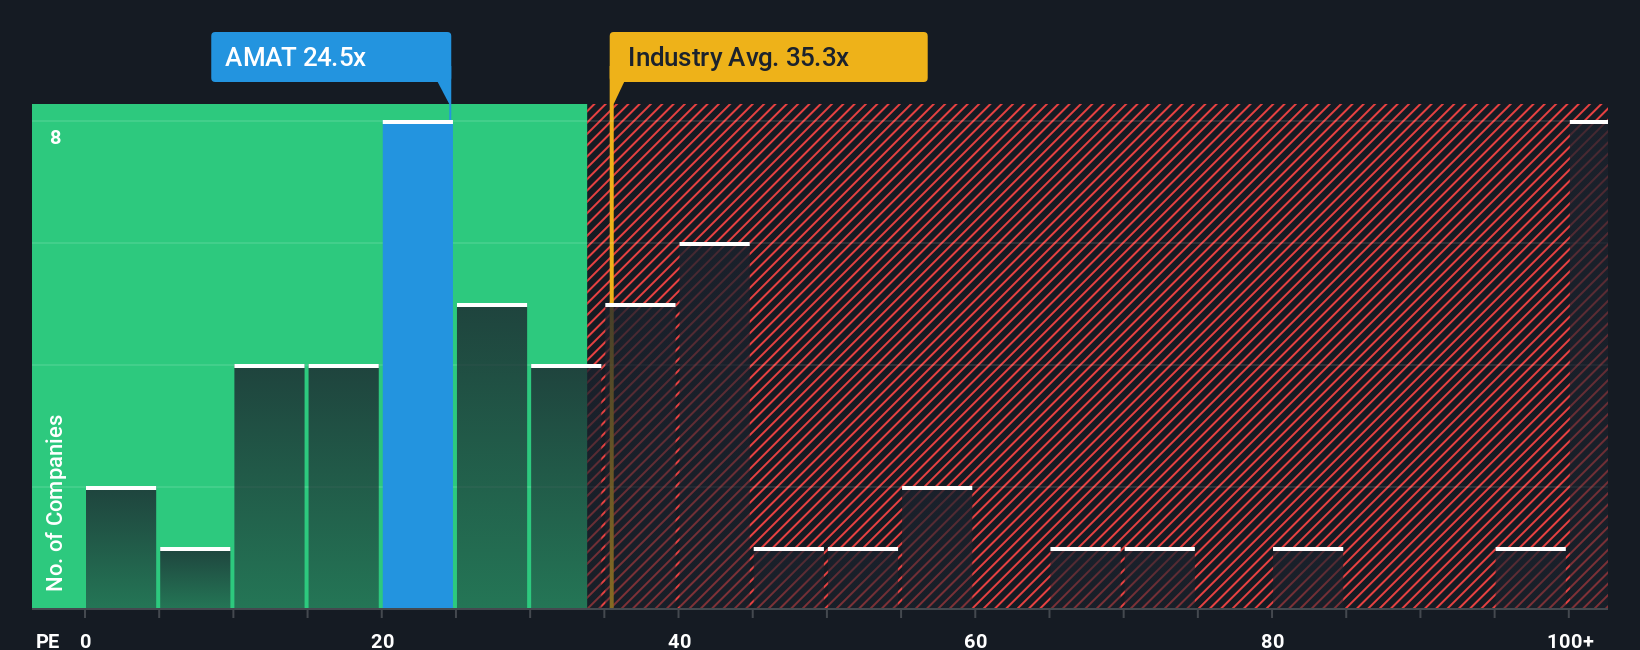
Applied Materials currently trades on about 30.4x earnings, which is below the broader Semiconductor industry average of roughly 37.9x and well under the 43.1x average of close peers. On the surface, that might make the stock look reasonably priced or even slightly cheap compared to its group.
Simply Wall St’s Fair Ratio framework goes a step further by estimating what a “normal” PE should be for this specific business given its earnings growth, profit margins, size, industry, and risk profile. For Applied Materials, the Fair Ratio comes out at about 29.6x, only slightly below the current 30.4x multiple. That suggests the valuation is broadly in line with what its fundamentals justify rather than stretched or deeply discounted.
Result: ABOUT RIGHT
PE ratios tell one story, but what if the real opportunity lies elsewhere? Discover 1450 companies where insiders are betting big on explosive growth.
Upgrade Your Decision Making: Choose your Applied Materials Narrative
Earlier we mentioned that there is an even better way to understand valuation. Let us introduce you to Narratives, which are simply your story about Applied Materials linked to a concrete forecast for its future revenue, earnings and margins, and then to your own view of fair value. You can easily build and track this on Simply Wall St’s Community page, where millions of investors share their perspectives, compare fair value to today’s price to decide whether the stock looks like a buy, hold, or sell, and see those Narratives update dynamically as new news or earnings arrive. One investor might build a more cautious Applied Materials Narrative that assumes mid single digit revenue growth, modest margin expansion and a fair value closer to the lower end of recent targets. Another, more optimistic investor might plug in high single digit growth, stronger margins and a fair value near the top of the range. The platform makes it effortless to see which story you actually agree with and what that implies for your decisions.
Do you think there's more to the story for Applied Materials? Head over to our Community to see what others are saying!
This article by Simply Wall St is general in nature. We provide commentary based on historical data and analyst forecasts only using an unbiased methodology and our articles are not intended to be financial advice. It does not constitute a recommendation to buy or sell any stock, and does not take account of your objectives, or your financial situation. We aim to bring you long-term focused analysis driven by fundamental data. Note that our analysis may not factor in the latest price-sensitive company announcements or qualitative material. Simply Wall St has no position in any stocks mentioned.
Have feedback on this article? Concerned about the content? Get in touch with us directly. Alternatively, email editorial-team@simplywallst.com