
Is Amphastar Pharmaceuticals Mispriced After a Tough Year and Promising Cash Flow Outlook in 2025?
- Wondering if Amphastar Pharmaceuticals is a bargain after its rough patch, or if the market sees something you do not? Let us unpack what the current share price might really be telling you about its long term value.
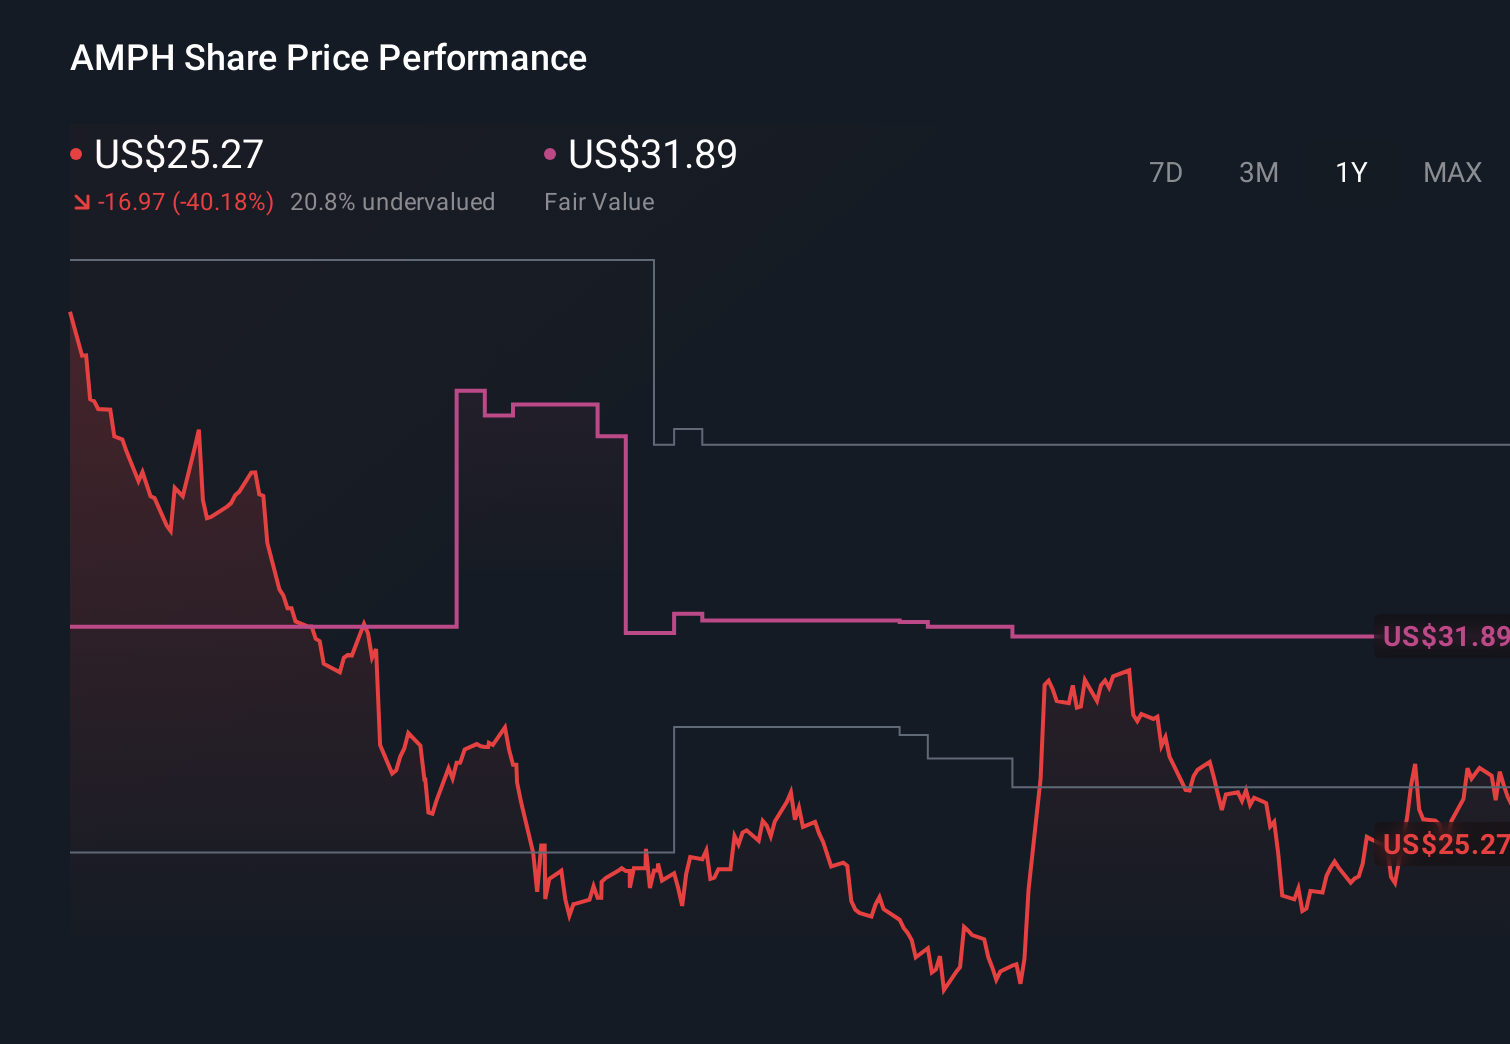
- The stock has slipped 3.8% over the last 7 days, but it is up 6.7% over the past month and still down 29.5% year to date and 41.2% over the last year. This profile hints at both recovery potential and lingering skepticism.
- Recent headlines around Amphastar have focused on its injectable and intranasal drug portfolio expanding into more specialized hospital and emergency care use cases, alongside continued attention on the company as a niche player in complex generics. This kind of product and pipeline narrative helps explain why the stock has seen bouts of renewed interest even after a tough year on the charts.
- Despite the volatility, Amphastar currently scores a strong 6/6 valuation check score, suggesting the shares look undervalued across all our standard tests. Next, we will walk through those methods while also exploring a more complete way to think about what the business is really worth.
Approach 1: Amphastar Pharmaceuticals Discounted Cash Flow (DCF) Analysis
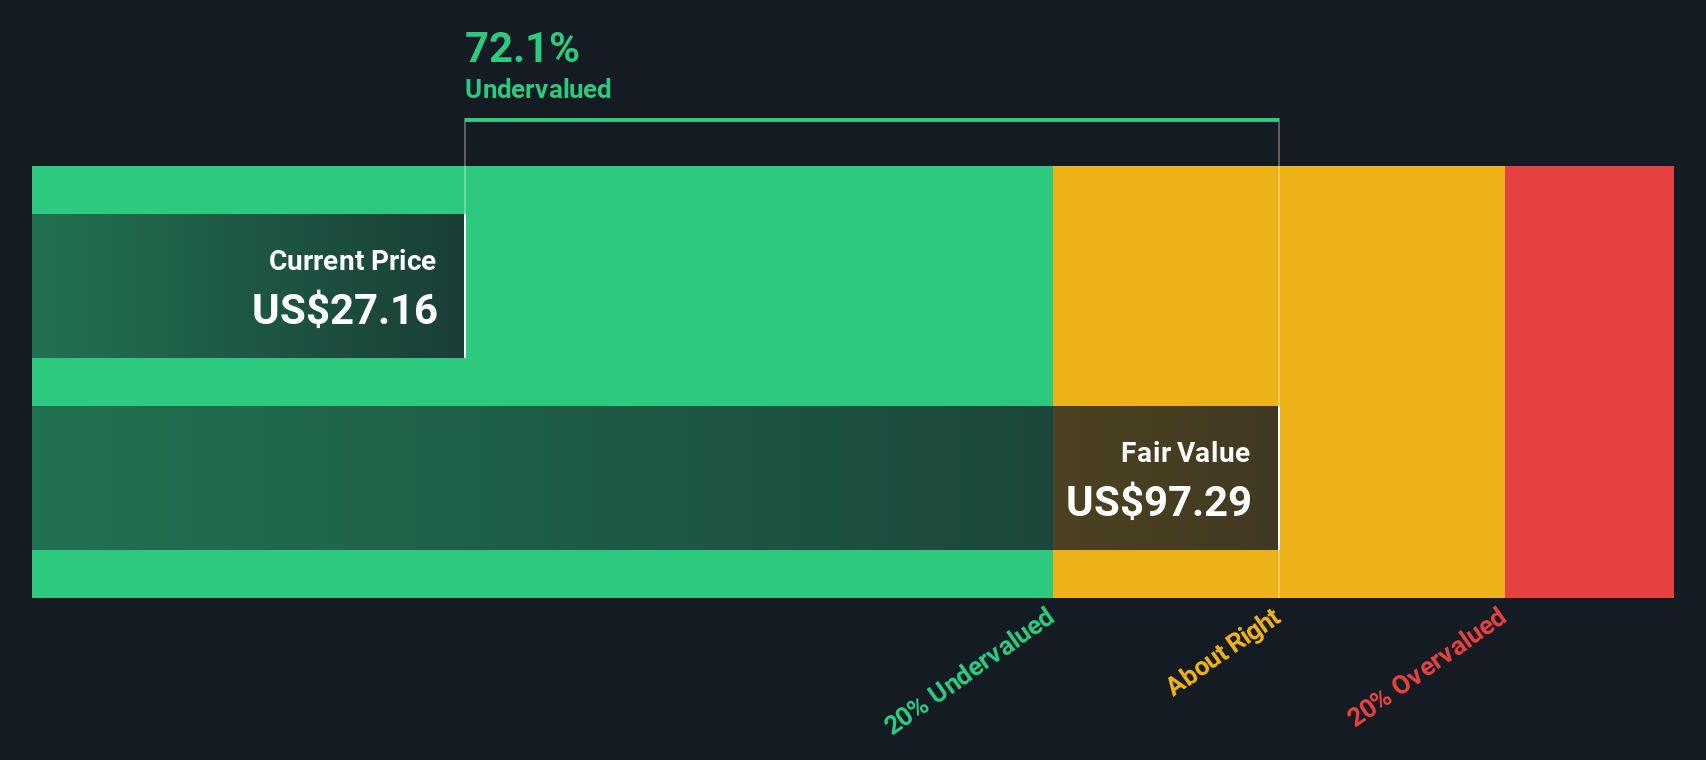
A Discounted Cash Flow model estimates what a company is worth by projecting the cash it can generate in the future and discounting those cash flows back to today. For Amphastar Pharmaceuticals, the model uses a 2 Stage Free Cash Flow to Equity framework, starting from its last twelve months Free Cash Flow of about $110.7 Million.
Analysts and internal estimates see Amphastar’s Free Cash Flow rising steadily, with projections reaching roughly $218.8 Million by 2035. Early years are based on analyst forecasts, while later years are extrapolated using modest growth assumptions by Simply Wall St to avoid overly aggressive expectations. All of these future cash flows are then discounted to reflect risk and the time value of money.
Putting these projections together, the DCF model suggests an intrinsic value of about $97.29 per share, implying the stock is trading at a 73.6% discount to its estimated fair value. That indicates a wide margin of safety if Amphastar can deliver on even a conservative version of these cash flow expectations.
Result: UNDERVALUED
Our Discounted Cash Flow (DCF) analysis suggests Amphastar Pharmaceuticals is undervalued by 73.6%. Track this in your watchlist or portfolio, or discover 895 more undervalued stocks based on cash flows.
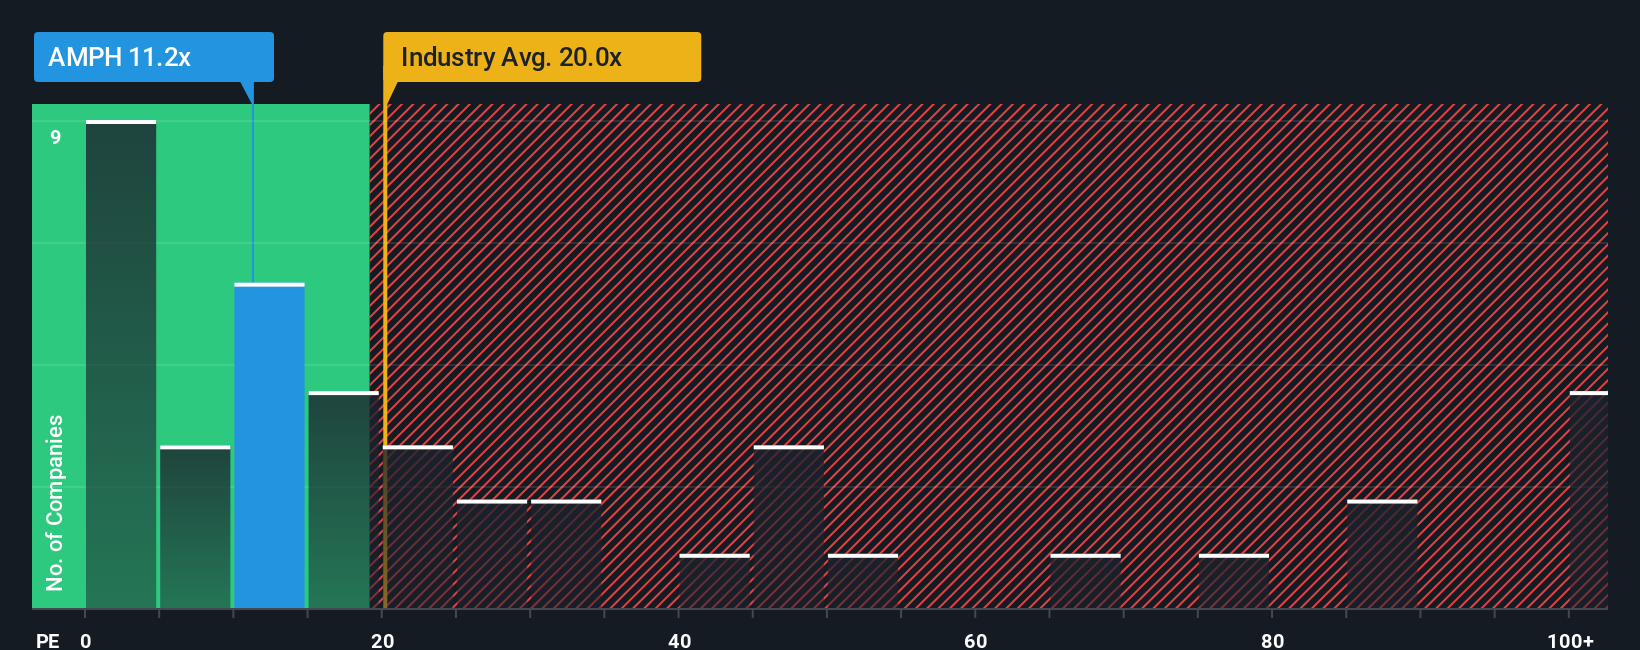
Approach 2: Amphastar Pharmaceuticals Price vs Earnings
For a profitable business like Amphastar Pharmaceuticals, the price to earnings, or PE, ratio is a practical way to gauge how much investors are paying for each dollar of current earnings. In broad terms, companies with stronger growth prospects and lower perceived risk can justify a higher PE, while slower growth or higher uncertainty usually warrant a lower one.
Amphastar currently trades on a PE of about 10.6x, noticeably below both the broader Pharmaceuticals industry average of roughly 19.2x and the peer group average of about 23.2x. Simply Wall St also calculates a Fair Ratio of 15.9x. This represents the PE multiple the stock might reasonably command once you factor in its earnings growth outlook, profitability profile, market cap, industry positioning and specific risks.
This Fair Ratio framework goes beyond a simple comparison with peers or sector averages by tailoring expectations to Amphastar’s own fundamentals rather than assuming it should trade like a typical pharma stock. With the Fair Ratio of 15.9x sitting well above the current 10.6x multiple, the PE analysis points to Amphastar being undervalued on an earnings basis.
Result: UNDERVALUED
PE ratios tell one story, but what if the real opportunity lies elsewhere? Discover 1450 companies where insiders are betting big on explosive growth.
Upgrade Your Decision Making: Choose your Amphastar Pharmaceuticals Narrative
Earlier we mentioned that there is an even better way to understand valuation, so let us introduce you to Narratives, a simple framework that lets you write the story behind your numbers by linking your view of Amphastar’s future revenues, earnings and margins to a concrete financial forecast and, ultimately, a fair value estimate. On Simply Wall St’s Community page, used by millions of investors, Narratives are an easy, guided tool where you spell out your assumptions, see how they translate into forecasts, and then compare your resulting Fair Value with today’s share price to decide whether Amphastar looks like a buy, hold or sell for you. Because Narratives automatically update as new information such as earnings releases, product news or industry shifts comes in, your fair value view stays live and responsive instead of static. For example, one Amphastar Narrative might lean cautious, focusing on intensifying generic competition and landing near the low end of analyst fair values around 25 dollars. In contrast, a more optimistic Narrative could emphasize pipeline progress, domestic capacity and higher margins to justify a target closer to 38 dollars.
Do you think there's more to the story for Amphastar Pharmaceuticals? Head over to our Community to see what others are saying!
This article by Simply Wall St is general in nature. We provide commentary based on historical data and analyst forecasts only using an unbiased methodology and our articles are not intended to be financial advice. It does not constitute a recommendation to buy or sell any stock, and does not take account of your objectives, or your financial situation. We aim to bring you long-term focused analysis driven by fundamental data. Note that our analysis may not factor in the latest price-sensitive company announcements or qualitative material. Simply Wall St has no position in any stocks mentioned.
Have feedback on this article? Concerned about the content? Get in touch with us directly. Alternatively, email editorial-team@simplywallst.com