
Is EOG Resources Mispriced After 2025 Share Price Slide And Strong DCF Upside?
- Wondering if EOG Resources at around $109 is a bargain or a value trap right now? You are not alone, and this breakdown will help you see where the market might be mispricing it.
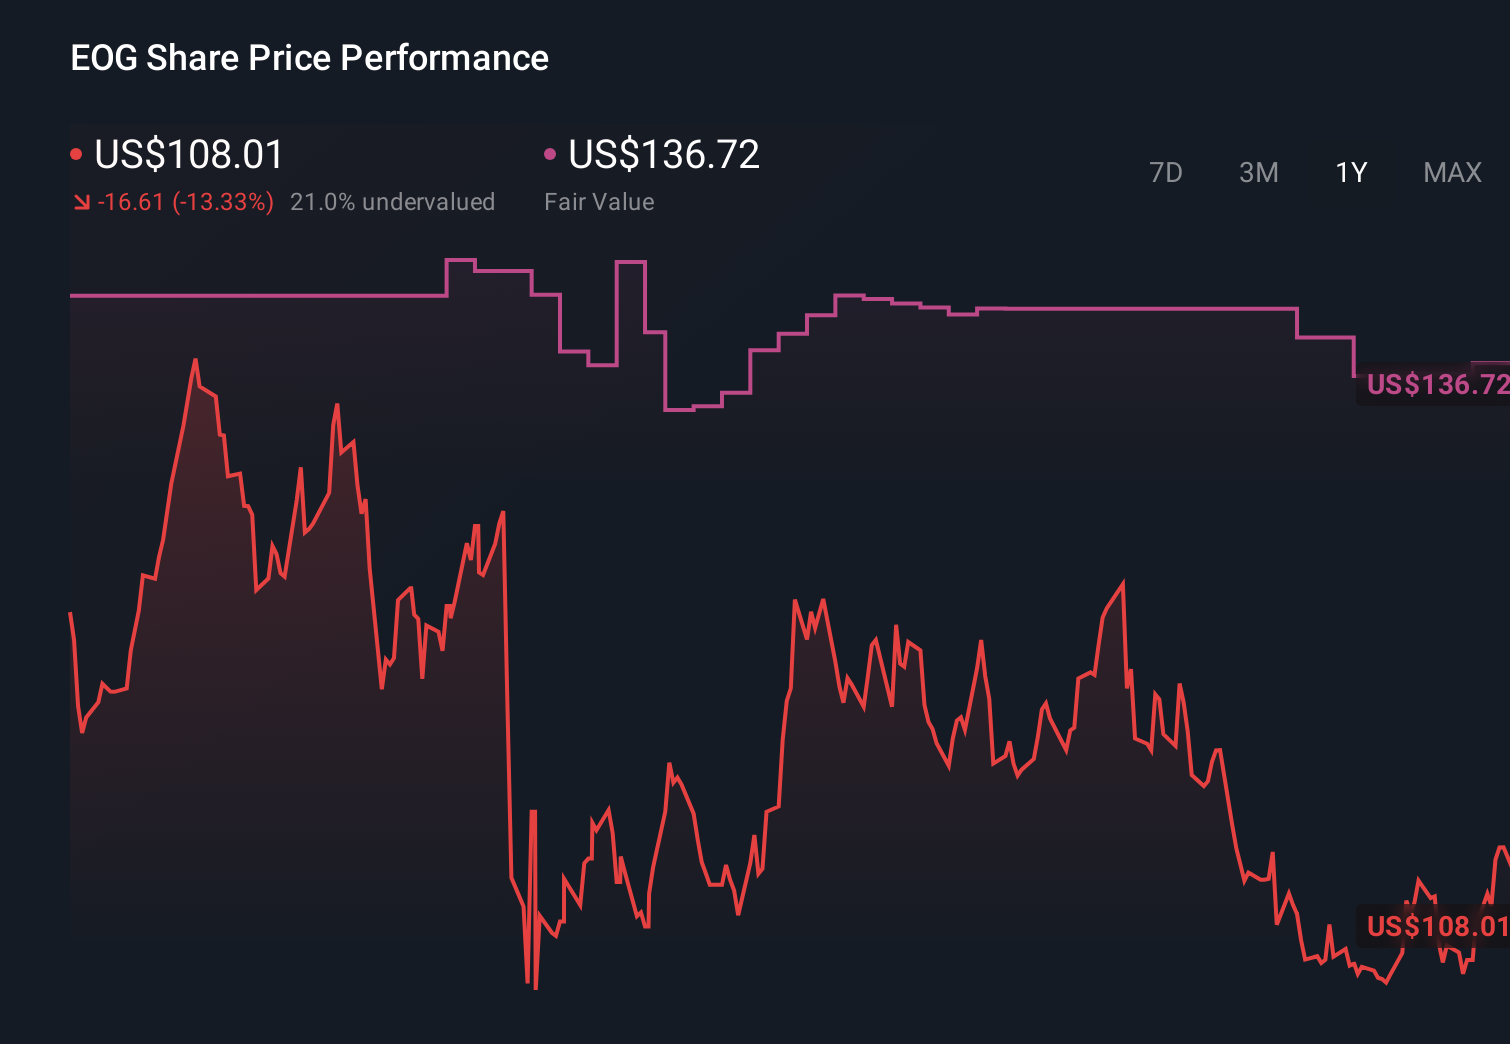
- The stock has slipped 1.9% over the last week and is still down 12.3% year to date and 11.3% over the past year, even after a strong 164.2% gain over five years, which hints at shifting sentiment around its long term prospects and risk.
- Recent headlines have focused on EOG tightening its capital discipline, selectively expanding its premium drilling inventory, and reiterating its focus on shareholder returns via buybacks and dividends, which all shape how investors think about its future cash flows. At the same time, sector wide moves in oil and gas prices and ongoing regulatory chatter around US shale development have added volatility to the whole energy complex, helping explain some of the choppiness in EOG's share price.
- Despite the recent wobble, EOG scores a strong 6/6 valuation score. This suggests it screens as undervalued across all our key checks. Next, we will unpack the different valuation approaches behind that number, before finishing with an even more intuitive way to think about what the stock is really worth.
Find out why EOG Resources's -11.3% return over the last year is lagging behind its peers.
Approach 1: EOG Resources Discounted Cash Flow (DCF) Analysis
A Discounted Cash Flow model estimates what a company is worth by projecting the cash it can generate in the future and discounting those dollars back to today. For EOG Resources, the model uses a 2 Stage Free Cash Flow to Equity approach based on its current and forecast cash generation.
EOG is currently producing about $4.1 billion in free cash flow, and analysts expect this to grow steadily, with Simply Wall St extending those forecasts beyond the usual 5 year window. By 2029, free cash flow is projected to reach roughly $6.2 billion, and the longer term projections continue to climb as the business matures.
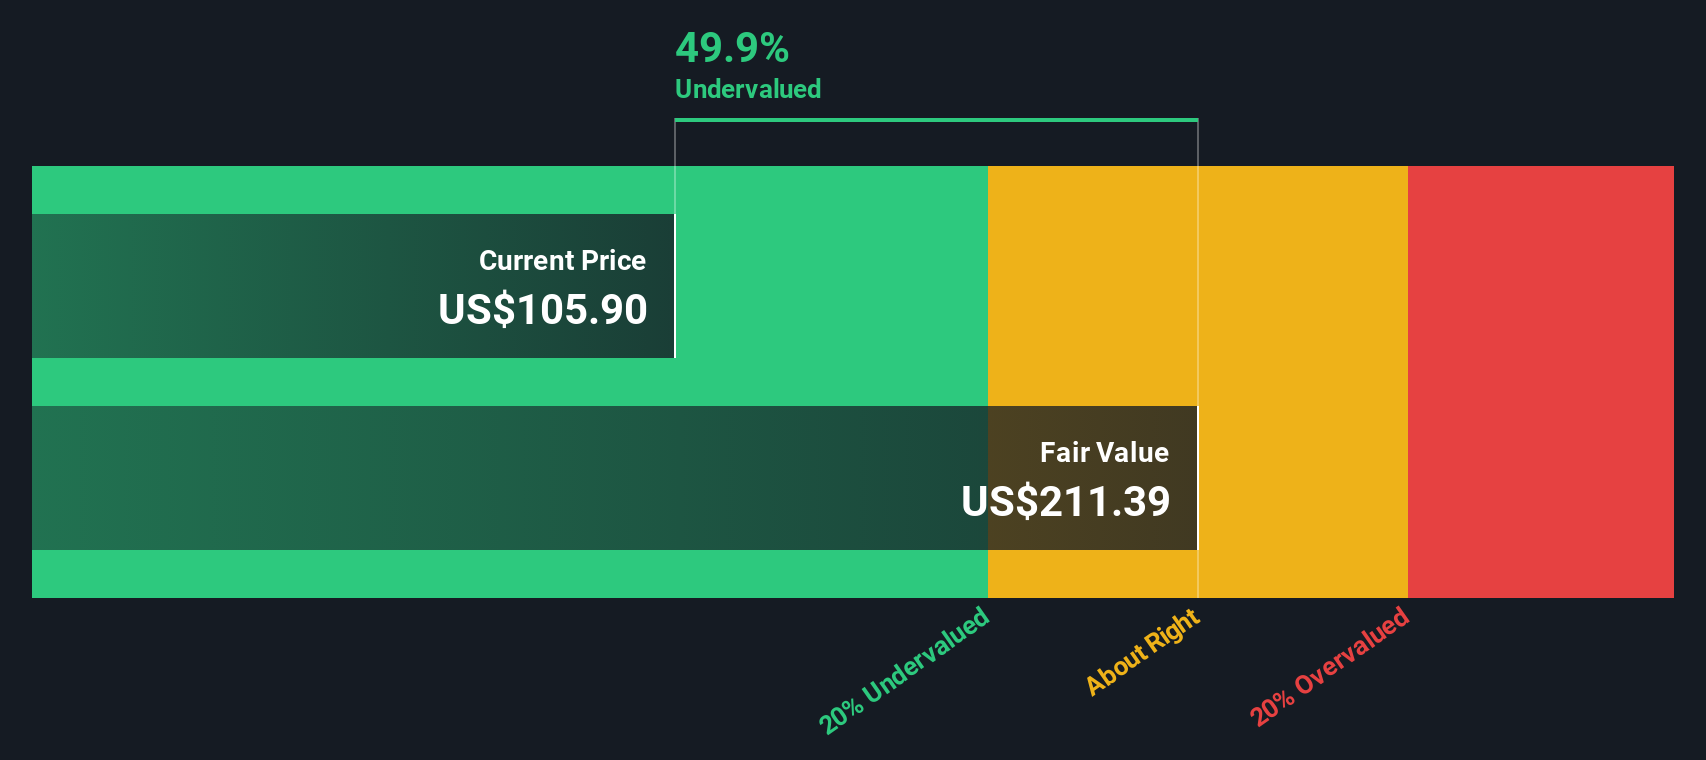
When all those future cash flows are discounted back to today, the resulting intrinsic value is about $301.49 per share. Compared with the current share price around $109, the DCF output indicates the stock is roughly 63.7% undervalued, which indicates that the market may be heavily discounting EOG's future cash generation.
Result: UNDERVALUED
Our Discounted Cash Flow (DCF) analysis suggests EOG Resources is undervalued by 63.7%. Track this in your watchlist or portfolio, or discover 895 more undervalued stocks based on cash flows.
Approach 2: EOG Resources Price vs Earnings
For profitable companies like EOG Resources, the price to earnings multiple is a straightforward way to judge value, because it links what investors pay today directly to the profits the business is already generating. In general, faster and more reliable earnings growth can justify a higher PE, while more volatile or cyclical earnings usually deserve a lower one to reflect higher risk.
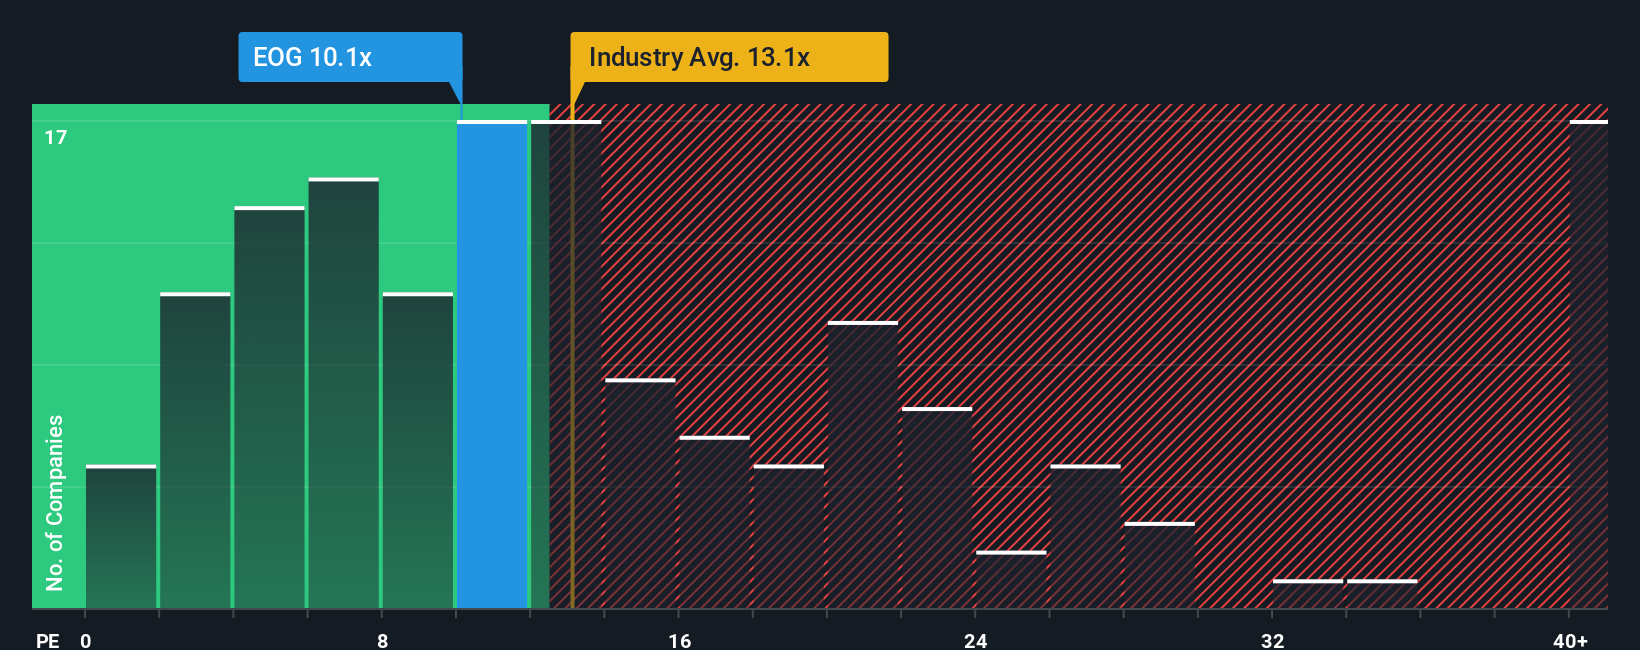
EOG currently trades on a PE of about 10.7x. That sits below the broader Oil and Gas industry average of roughly 13.5x and also under the peer group average of around 13.3x, which on the surface suggests a discount to comparable names. However, Simply Wall St goes a step further with its Fair Ratio, a proprietary PE estimate that considers EOG's earnings growth outlook, profitability, risk profile, industry positioning and market cap. This tends to be more informative than a simple peer or industry comparison, which can be skewed by companies at very different stages of their cycles.
For EOG, the Fair Ratio is 19.4x, higher than the current 10.7x multiple, indicating that the shares may be undervalued on an earnings based view.
Result: Potentially undervalued
PE ratios tell one story, but what if the real opportunity lies elsewhere? Discover 1450 companies where insiders are betting big on explosive growth.
Upgrade Your Decision Making: Choose your EOG Resources Narrative
Earlier we mentioned that there is an even better way to understand valuation, so let us introduce you to Narratives, which are simply your own clear story about a company that links what it does in the real world to a financial forecast and, ultimately, to a fair value estimate that you can compare to the current share price.
On Simply Wall St’s Community page, Narratives let you plug in your assumptions about EOG Resources future revenue, earnings growth, and margins, then instantly translate that story into projected cash flows and a Fair Value. This helps you see in plain terms whether your view implies the stock is worth more or less than today’s price and therefore whether it looks like a buy, hold, or sell.
Because Narratives are dynamic and automatically refresh when new information like quarterly results, guidance changes, or major news hits the market, you can quickly update your story and see how your fair value shifts. For example, one investor might build a bullish Narrative around rising North American gas demand, capital efficiency and a fair value near the upper end of analyst targets around $170. A more cautious investor could focus on energy transition, integration and commodity price risks and land closer to the low end near $120, with both views coexisting transparently on the platform.
Do you think there's more to the story for EOG Resources? Head over to our Community to see what others are saying!
This article by Simply Wall St is general in nature. We provide commentary based on historical data and analyst forecasts only using an unbiased methodology and our articles are not intended to be financial advice. It does not constitute a recommendation to buy or sell any stock, and does not take account of your objectives, or your financial situation. We aim to bring you long-term focused analysis driven by fundamental data. Note that our analysis may not factor in the latest price-sensitive company announcements or qualitative material. Simply Wall St has no position in any stocks mentioned.
Have feedback on this article? Concerned about the content? Get in touch with us directly. Alternatively, email editorial-team@simplywallst.com