
Has SoftBank’s 102% Rally in 2025 Outrun Its Fundamentals?
- If you are wondering whether SoftBank Group’s huge tech bets and sprawling portfolio make the current share price a bargain or a bubble, you are not alone. That is exactly what we are going to unpack here.
- The stock has risen 102.1% year to date and 104.4% over the last year, even after a sharp 16.2% pullback in the past month and an 11.9% rebound over the last week. As a result, the risk reward profile is shifting fast.
- Much of that volatility has been driven by headlines around SoftBank’s Vision Fund exposure to AI related names, high profile exits from some tech holdings, and renewed talk of fresh investment rounds in fast growing startups. At the same time, investors are reacting to leadership’s signals about capital allocation, from buybacks to potential new listings of portfolio companies. All of this feeds into how the market is trying to price the group’s sprawling assets.
- Right now, Simply Wall St’s valuation framework gives SoftBank Group a 3/6 valuation score, suggesting it looks undervalued on some checks but not all. In the rest of this article we will compare the usual valuation methods before finishing with a more complete way of thinking about what this complex holding company is really worth.
Approach 1: SoftBank Group Dividend Discount Model (DDM) Analysis
The Dividend Discount Model estimates what a share is worth by projecting all future dividends to shareholders and discounting them back to today, based on expected growth and risk.
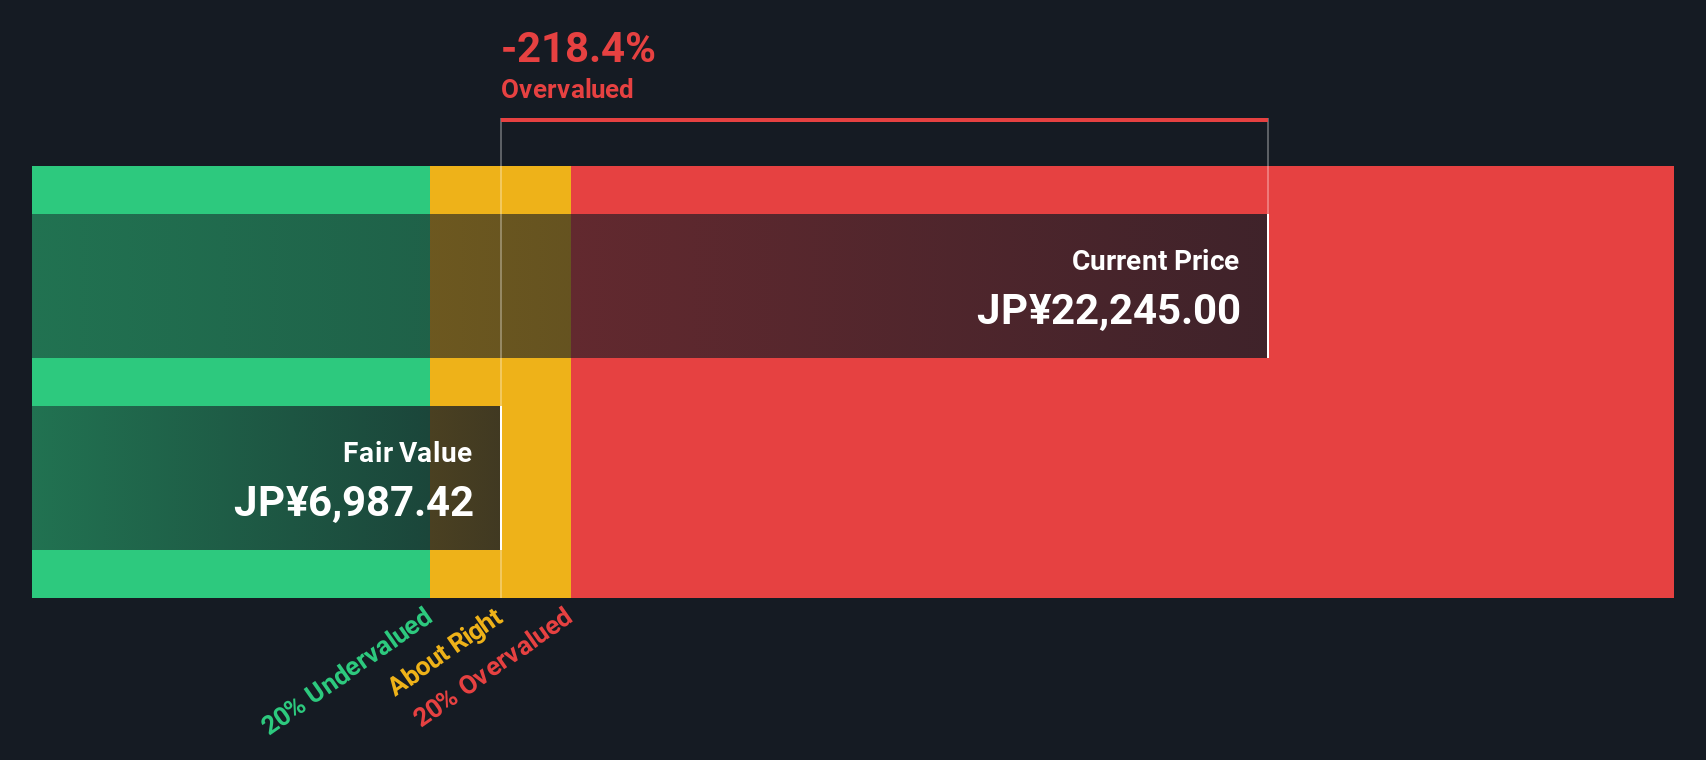
For SoftBank Group, the model uses an annual dividend per share of approximately ¥46.14 and a relatively low return on equity of about 4.18%. The payout ratio is extremely high at just over 206%, which means the company is paying out more in dividends than it is generating in earnings. This can be a signal that the current dividend level may not be sustainable over the long term.
Because of that risk, the long run dividend growth rate is capped at just 0.6%, even though near term growth expectations are higher at roughly 4.1%. When those conservative dividend projections are discounted back, the DDM implies an intrinsic value of about ¥1,099 per share.
Compared with the current market price, this points to the stock trading at roughly 1,598.5% above its DDM value on this metric alone.
Result: OVERVALUED
Our Dividend Discount Model (DDM) analysis suggests SoftBank Group may be overvalued by 1598.5%. Discover 893 undervalued stocks or create your own screener to find better value opportunities.
Approach 2: SoftBank Group Price vs Earnings
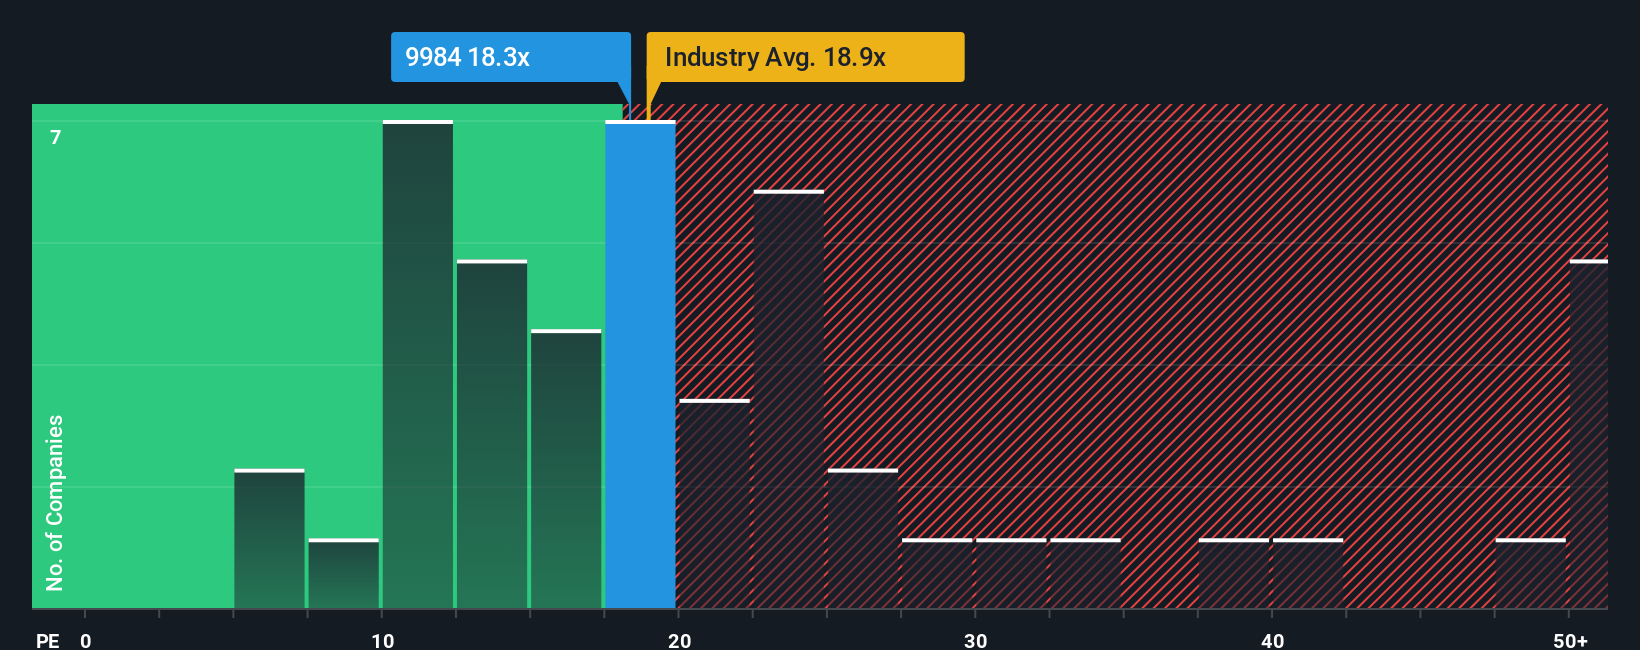
For profitable companies like SoftBank Group, the price to earnings, or PE, ratio is a useful way to judge whether the market price makes sense relative to the profits the business is generating. Investors are essentially asking how many years of current earnings they are willing to pay for upfront.
What counts as a normal or fair PE depends on how quickly earnings are expected to grow and how risky those earnings are. Faster, more reliable growth usually justifies a higher multiple, while volatile or uncertain earnings tend to deserve a lower one.
SoftBank Group currently trades on a PE of about 8.71x, which is well below both the wireless telecom industry average of roughly 17.60x and the broader peer group average of around 16.52x. Simply Wall St’s Fair Ratio for SoftBank, at about 10.59x, estimates the multiple the stock should trade on after adjusting for its own growth outlook, risks, profitability, industry and market cap. This tailored Fair Ratio is more informative than a simple peer or industry comparison because it reflects SoftBank’s specific profile rather than assuming it should look like the average company.
Comparing the Fair Ratio of 10.59x with the current 8.71x suggests the shares are trading at a discount on this earnings based view.
Result: UNDERVALUED
PE ratios tell one story, but what if the real opportunity lies elsewhere? Discover 1451 companies where insiders are betting big on explosive growth.
Upgrade Your Decision Making: Choose your SoftBank Group Narrative
Earlier we mentioned that there is an even better way to understand valuation. Let us introduce you to Narratives, an easy tool on Simply Wall St’s Community page that lets you turn your view of a company into a simple story backed by a financial forecast. It links what you believe about SoftBank Group’s AI investments, exits and risks to assumptions for future revenue, earnings and margins, and then to a Fair Value you can compare with today’s share price to help you decide whether to buy, hold or sell. The Narrative itself updates dynamically as new news or earnings arrive. One investor might build a bullish SoftBank Narrative that leans into potential AI infrastructure gains and a Fair Value closer to the high analyst target of about ¥20,000. A more cautious investor might focus on leverage, regulation and tech valuation risk and land nearer the low target of roughly ¥9,400. Both can instantly see how their different stories translate into different numbers and decisions.
Do you think there's more to the story for SoftBank Group? Head over to our Community to see what others are saying!

This article by Simply Wall St is general in nature. We provide commentary based on historical data and analyst forecasts only using an unbiased methodology and our articles are not intended to be financial advice. It does not constitute a recommendation to buy or sell any stock, and does not take account of your objectives, or your financial situation. We aim to bring you long-term focused analysis driven by fundamental data. Note that our analysis may not factor in the latest price-sensitive company announcements or qualitative material. Simply Wall St has no position in any stocks mentioned.
Have feedback on this article? Concerned about the content? Get in touch with us directly. Alternatively, email editorial-team@simplywallst.com