
Has Asana’s Recent 13% Rebound Created a 2025 Opportunity?
- Wondering if Asana at around $15 is a bargain or a value trap? You are not alone. This article is going to unpack what the current price really implies.
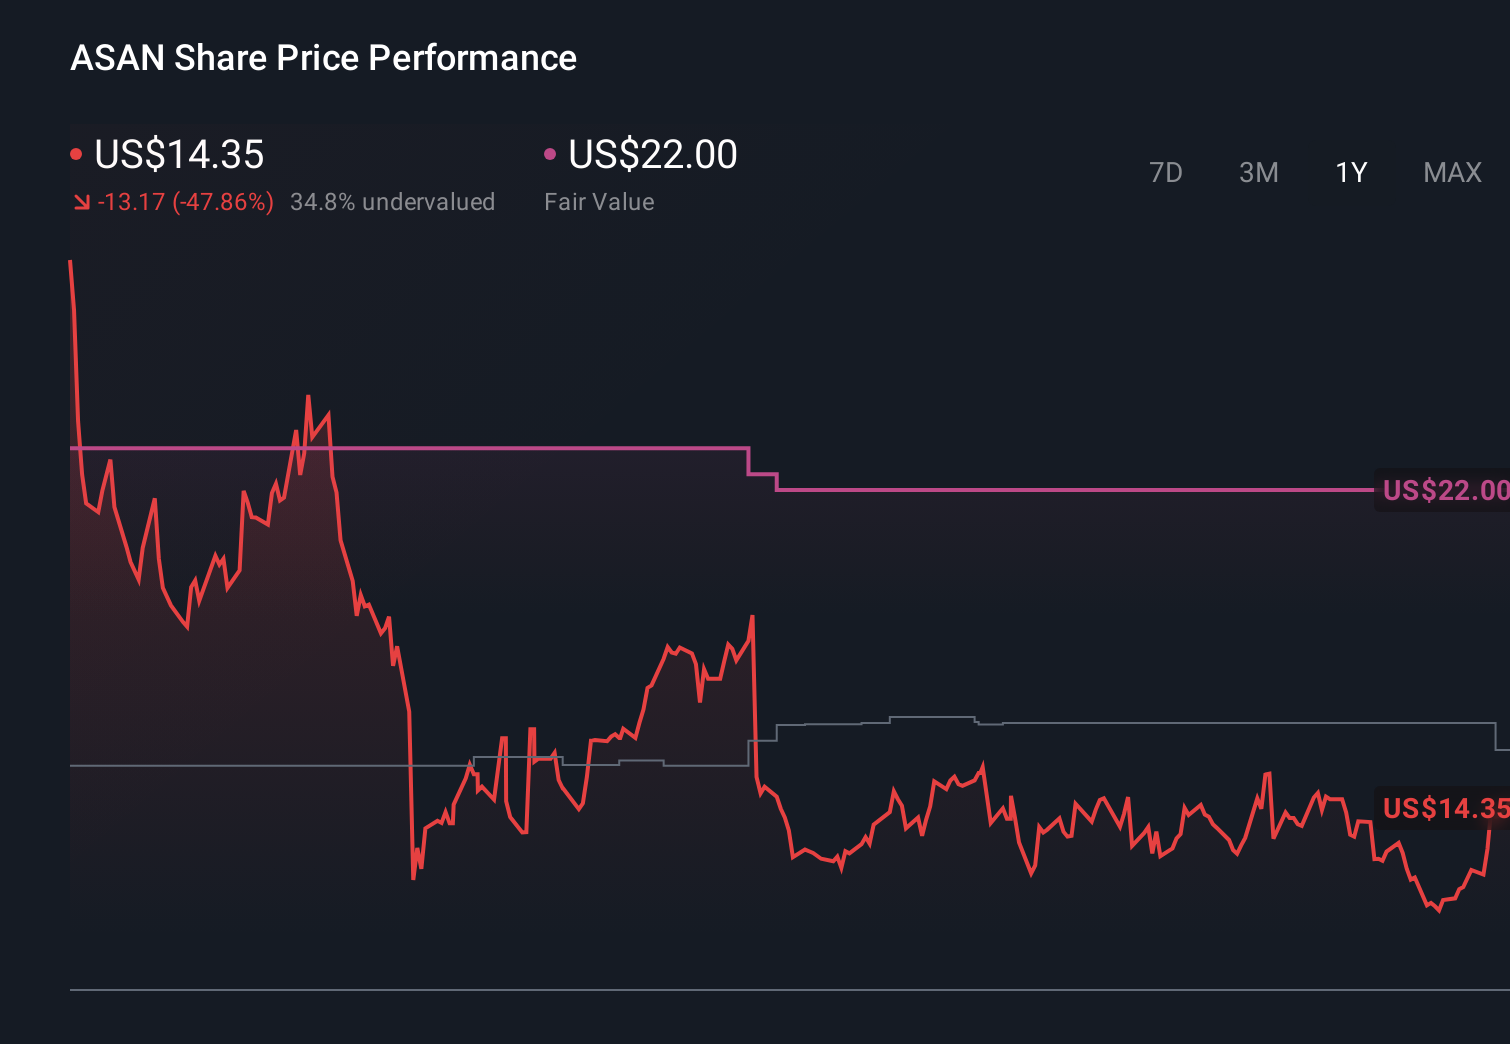
- After a bumpy few years, the stock has bounced about 12.8% over the last week and 13.4% over the last month, even though it is still down sharply at -23.9% year to date and -35.5% over the last year.
- Those moves have come as investors refocus on productivity and collaboration software in a tougher macro backdrop, with money rotating back into a handful of growth names seen as potential long term winners. At the same time, ongoing conversations around workplace efficiency, cost cutting, and digital transformation have kept workflow tools like Asana in the spotlight for both customers and the market.
- On our framework, Asana currently scores 4/6 on valuation checks. This suggests it screens as undervalued on most, but not all, metrics. Next we will walk through those methods and point to an even better way to think about its true value by the end of the article.
Find out why Asana's -35.5% return over the last year is lagging behind its peers.
Approach 1: Asana Discounted Cash Flow (DCF) Analysis
A Discounted Cash Flow, or DCF, model estimates what a company is worth by projecting the cash it can generate in the future and discounting those cash flows back to today in dollar terms.
For Asana, the latest twelve month free cash flow is about $64.5 million, and analysts expect this to grow steadily as the business scales. Under a 2 Stage Free Cash Flow to Equity model, free cash flow is projected to rise to around $311.2 million in 2035, with analyst forecasts covering the next few years and Simply Wall St extrapolating further growth beyond that horizon.
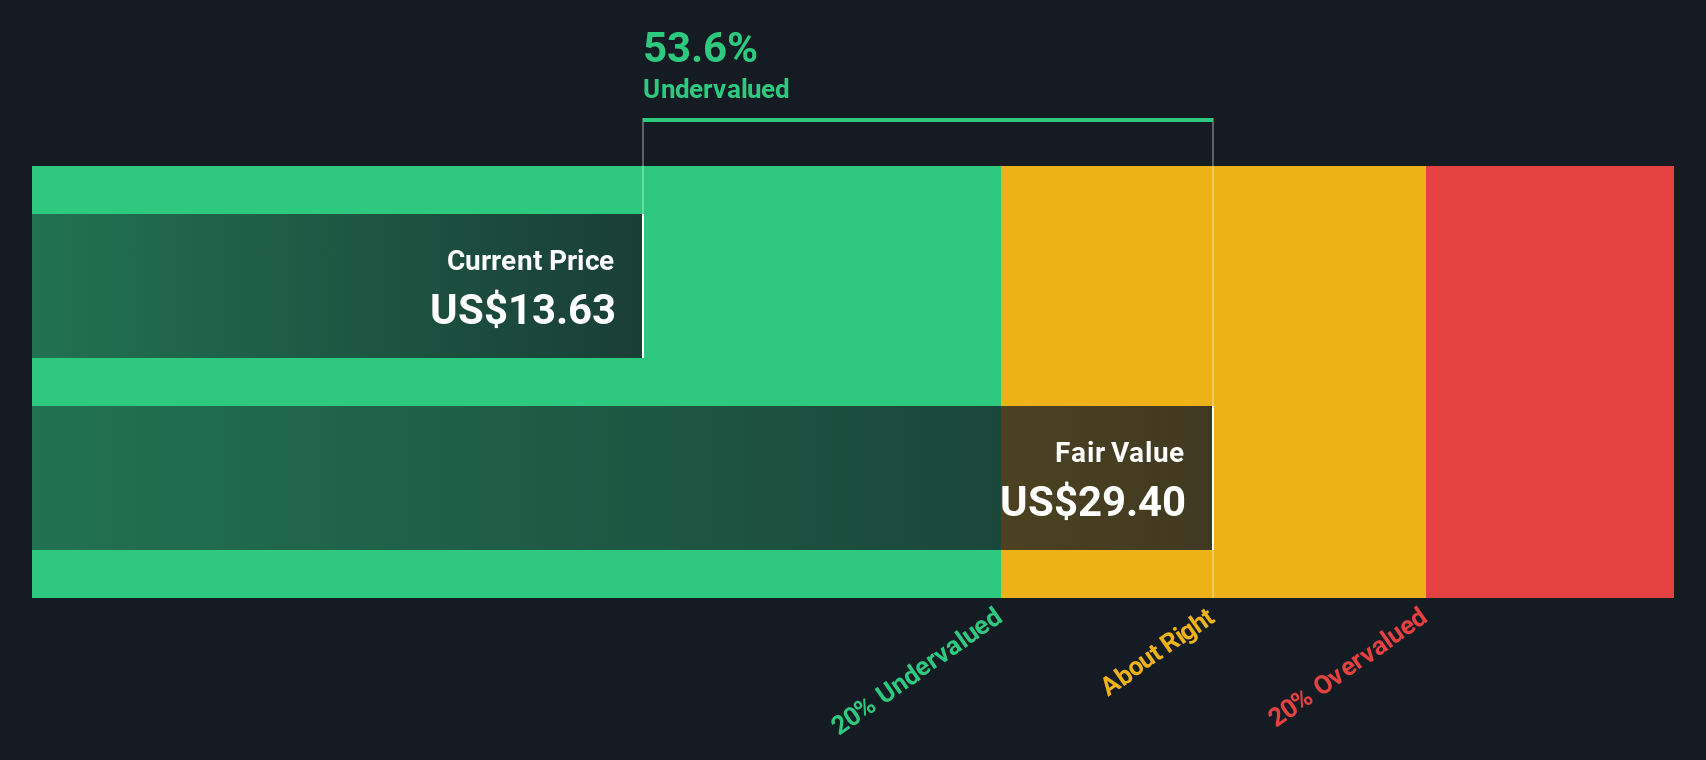
When these future cash flows are discounted back, the intrinsic value for Asana is estimated at roughly $16.25 per share. Compared with the current share price near $15, this suggests the stock is trading at about a 7.1% discount to its estimated fair value, which is a modest margin of undervaluation rather than a deep bargain.
Result: ABOUT RIGHT
Asana is fairly valued according to our Discounted Cash Flow (DCF), but this can change at a moment's notice. Track the value in your watchlist or portfolio and be alerted on when to act.
Approach 2: Asana Price vs Sales
For growing software businesses that are not yet consistently profitable, the price to sales ratio is often a better valuation yardstick than earnings based metrics, because revenue is less volatile and not as distorted by near term investment in growth.
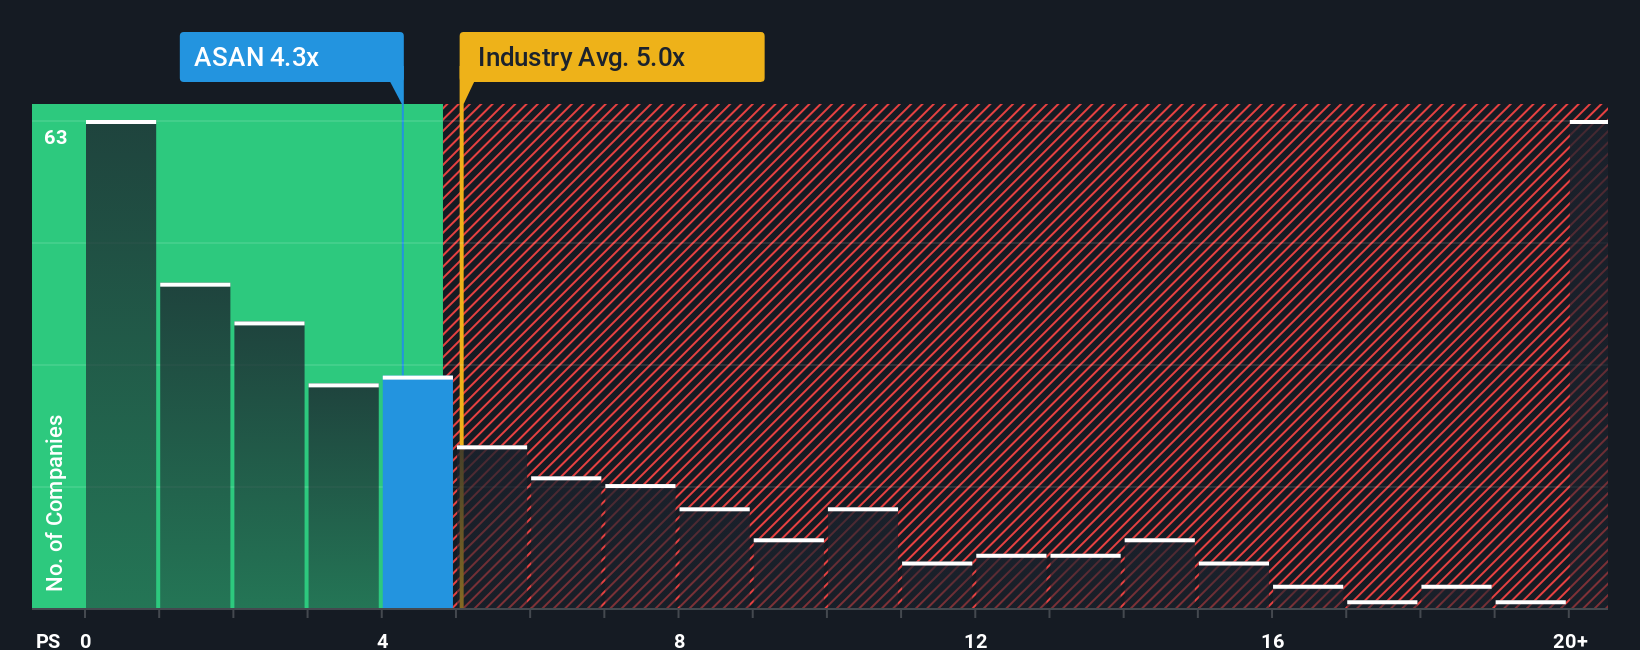
In general, faster revenue growth and lower perceived risk can justify a higher price to sales multiple, while slower growth or higher risk tend to pull a normal or fair multiple lower. Asana currently trades on about 4.63x sales, which is slightly below the broader Software industry average of roughly 4.95x, and also below the peer group average of around 6.40x. This suggests the market is pricing it at a discount to many comparable names.
Simply Wall St goes a step further by estimating a Fair Ratio of 6.03x for Asana. This is a proprietary view of what its price to sales multiple should be once factors like growth outlook, profitability profile, industry positioning, market cap, and company specific risks are all taken into account. Because this Fair Ratio is meaningfully higher than the current 4.63x, the stock appears undervalued on this framework, even after allowing for execution and macro risks.
Result: UNDERVALUED
PS ratios tell one story, but what if the real opportunity lies elsewhere? Discover 1451 companies where insiders are betting big on explosive growth.
Upgrade Your Decision Making: Choose your Asana Narrative
Earlier we mentioned that there is an even better way to understand valuation, so let us introduce Narratives, which are simple, story driven forecasts where you spell out how you think a company like Asana will grow, translate that story into assumptions for future revenue, earnings, and margins, and then connect it all the way through to a fair value that you can easily compare with today’s share price. On Simply Wall St’s Community page, millions of investors use Narratives to turn their views into numbers, see whether their Fair Value is above or below the current Price, and decide if that means they should consider buying, holding, or selling, with each Narrative automatically updating when new information such as earnings reports or major product news arrives. For example, one optimistic Asana Narrative might lean toward the higher analyst target of $22, assuming strong AI adoption and sustained margin expansion, while a more cautious Narrative might sit closer to the $10 bear case, assuming competitive and macro risks bite harder. Seeing these side by side makes it clear which story you actually believe and what that implies for your next move.
Do you think there's more to the story for Asana? Head over to our Community to see what others are saying!
This article by Simply Wall St is general in nature. We provide commentary based on historical data and analyst forecasts only using an unbiased methodology and our articles are not intended to be financial advice. It does not constitute a recommendation to buy or sell any stock, and does not take account of your objectives, or your financial situation. We aim to bring you long-term focused analysis driven by fundamental data. Note that our analysis may not factor in the latest price-sensitive company announcements or qualitative material. Simply Wall St has no position in any stocks mentioned.
Have feedback on this article? Concerned about the content? Get in touch with us directly. Alternatively, email editorial-team@simplywallst.com