
Assessing TechnipFMC (NYSE:FTI) Valuation After a Strong Multi‑Year Share Price Run
TechnipFMC (FTI) has quietly built an impressive track record, with the stock up about 55% this year and roughly 3 times over the past 3 years, driven by steady revenue and earnings growth.
See our latest analysis for TechnipFMC.
The recent 1 month share price return of 4.85% and 3 month share price return of 13.8% suggest momentum is still building. At the same time, the 3 year total shareholder return above 300% highlights how consistently the story has been rewarded over time.
If TechnipFMC has you thinking about where the next strong run could come from, this is a good moment to explore fast growing stocks with high insider ownership for more ideas.
With shares flirting with analyst targets but trading at a hefty intrinsic discount, investors face a key question: is TechnipFMC still mispriced by the market, or are expectations already fully baking in the next leg of growth?
Most Popular Narrative Narrative: 0.2% Overvalued
With TechnipFMC last closing at $45.86 against a narrative fair value of $45.75, the story hinges on how durable its cash and margin gains really are.
Expansion and recurring tail of Subsea services revenues, driven by a growing installed base and long-duration contracts (20 to 35 years), provide predictable, high-margin income streams that underpin long-term earnings stability and net margin improvement.
Curious how steady offshore demand, rising margins, and shrinking share count can all support this price? The narrative hides one especially aggressive earnings path. Want to see it?
Result: Fair Value of $45.75 (ABOUT RIGHT)
Have a read of the narrative in full and understand what's behind the forecasts.
However, this hinges on offshore momentum persisting, as geopolitical disruptions or a faster shift away from fossil fuels could quickly undermine backlog visibility and margins.
Find out about the key risks to this TechnipFMC narrative.
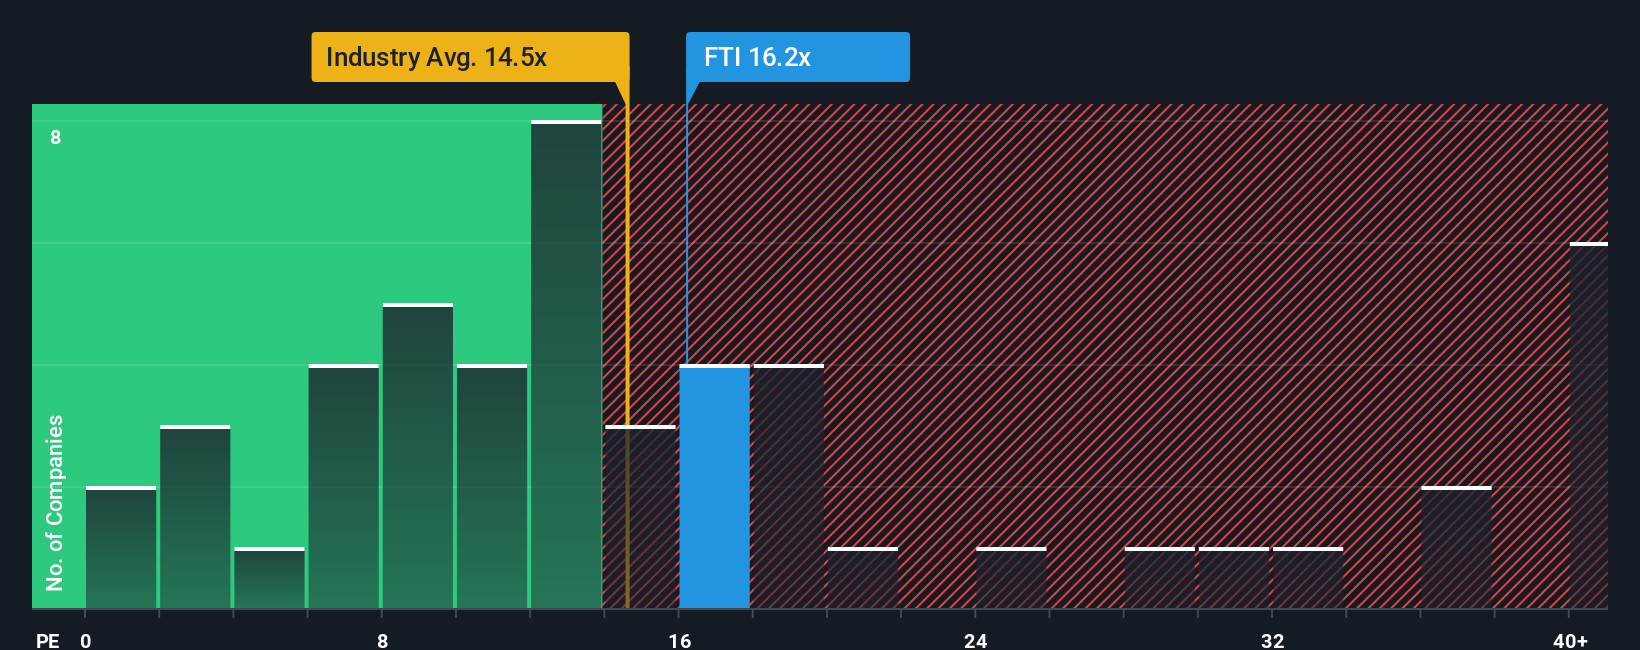
Another View: Multiples Point to Richer Pricing
Our fair value work indicates that TechnipFMC appears inexpensive on some measures, but its 19.1x earnings multiple tells a different story. That is richer than both peers at 16.4x and a fair ratio of 18x, suggesting less margin of safety if growth or margins slip from expectations.
See what the numbers say about this price — find out in our valuation breakdown.
Simply Wall St performs a discounted cash flow (DCF) on every stock in the world every day (check out TechnipFMC for example). We show the entire calculation in full. You can track the result in your watchlist or portfolio and be alerted when this changes, or use our stock screener to discover 893 undervalued stocks based on their cash flows. If you save a screener we even alert you when new companies match - so you never miss a potential opportunity.
Build Your Own TechnipFMC Narrative
If you want to dig into the numbers yourself or think the story should read differently, you can craft a fresh view in minutes using Do it your way.
A great starting point for your TechnipFMC research is our analysis highlighting 3 key rewards and 1 important warning sign that could impact your investment decision.
Ready for more high conviction ideas?
Do not stop at a single opportunity. Use the Simply Wall St screener to line up your next moves before the crowd spots them.
- Strengthen your long term returns by targeting steady income opportunities through these 15 dividend stocks with yields > 3% with resilient payouts.
- Position yourself early in structural growth themes by focusing on these 27 AI penny stocks that could reshape entire industries.
- Capitalize on mispriced quality by zeroing in on these 893 undervalued stocks based on cash flows that trade below their cash flow potential.
This article by Simply Wall St is general in nature. We provide commentary based on historical data and analyst forecasts only using an unbiased methodology and our articles are not intended to be financial advice. It does not constitute a recommendation to buy or sell any stock, and does not take account of your objectives, or your financial situation. We aim to bring you long-term focused analysis driven by fundamental data. Note that our analysis may not factor in the latest price-sensitive company announcements or qualitative material. Simply Wall St has no position in any stocks mentioned.
Have feedback on this article? Concerned about the content? Get in touch with us directly. Alternatively, email editorial-team@simplywallst.com