
Is It Too Late To Consider Woodward After Its Strong Multi Year Share Price Surge?
- Wondering if Woodward is still worth buying after its big run up, or if you are late to the party? This breakdown will walk you through what the current price really implies.
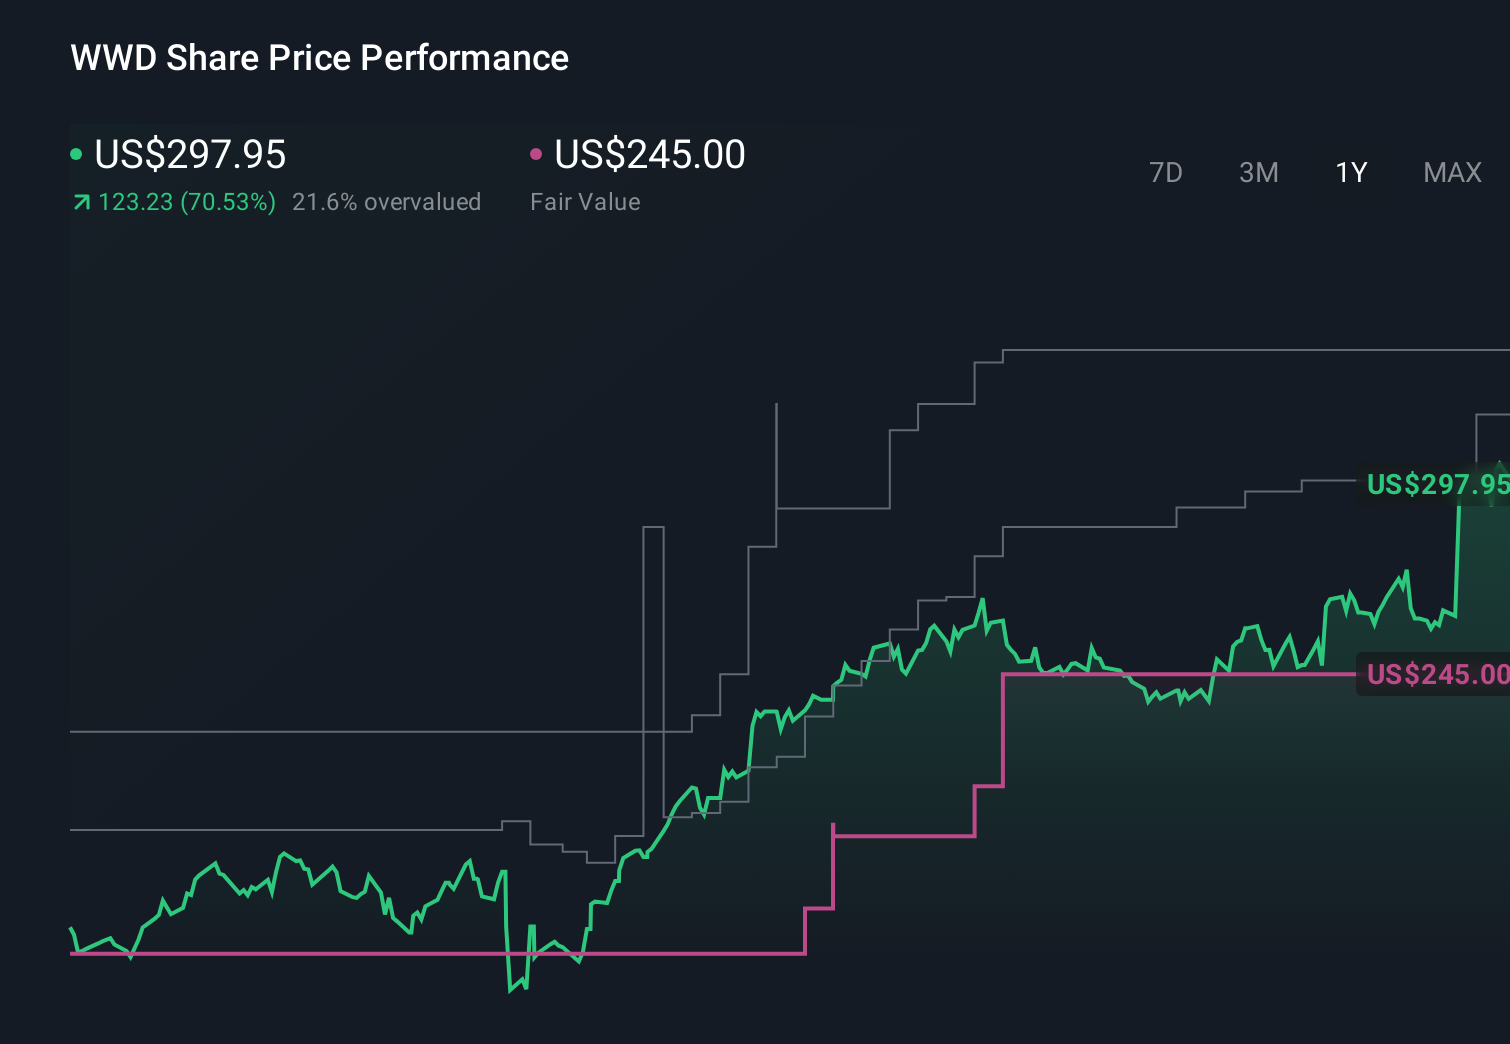
- The stock has cooled slightly over the last week, down 1.3%, but it is still up 6.0% over 30 days, 67.9% year to date and 61.1% over the last year. Gains of 208.3% over 3 years and 155.7% over 5 years have reshaped how the market sees its growth and risk profile.
- Investors have been reacting to a steady drumbeat of positive commentary around aerospace and defense demand, where Woodward is a key supplier in propulsion and energy control systems. In addition, themes like fleet modernization and more efficient power solutions have kept the stock on the radar of both growth focused and quality focused investors.
- Despite that optimism, Woodward currently scores just 0/6 on our valuation checks. Next, we will unpack what traditional valuation methods say about the stock today and why there may be a different way to think about fair value by the end of this article.
Woodward scores just 0/6 on our valuation checks. See what other red flags we found in the full valuation breakdown.
Approach 1: Woodward Discounted Cash Flow (DCF) Analysis
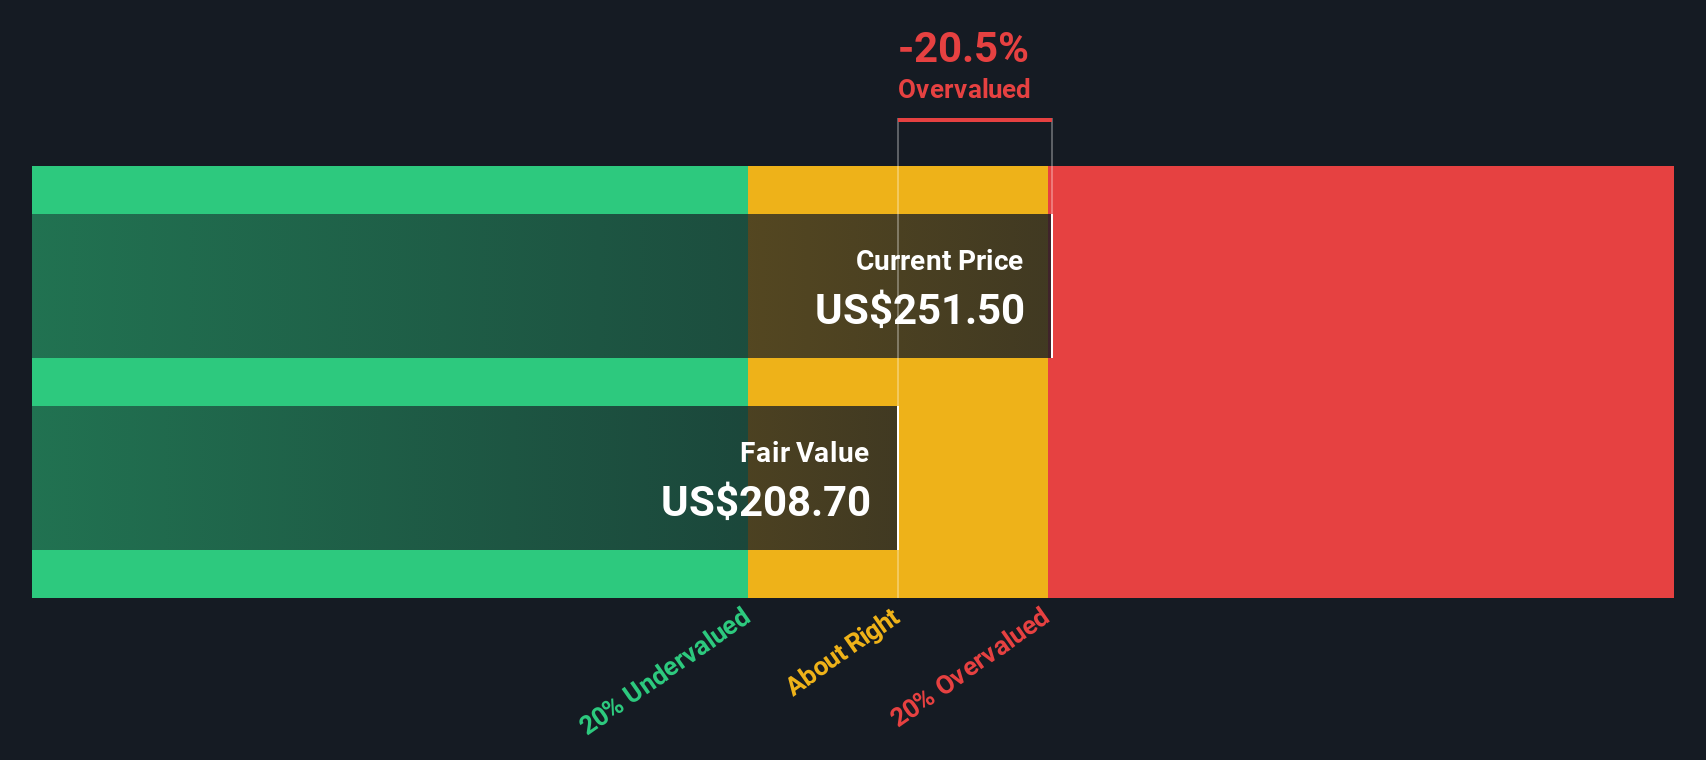
A Discounted Cash Flow model estimates what a business is worth today by projecting its future cash flows and then discounting those back to the present. For Woodward, the model uses a 2 Stage Free Cash Flow to Equity approach based on $360.8 Million of last twelve months free cash flow.
Analysts forecast Woodward’s free cash flow to rise from around the mid $300 Million range in 2026 to $660.6 Million by 2029, with Simply Wall St extrapolating further growth to over $1.0 Billion by 2035. These projections, all in $, are discounted back and summed to arrive at an intrinsic value estimate of roughly $277.12 per share.
Compared to the current share price, this DCF output implies Woodward is about 3.8% overvalued. This is a relatively small gap and within a reasonable margin of error for long range forecasts.
Result: ABOUT RIGHT
Woodward is fairly valued according to our Discounted Cash Flow (DCF), but this can change at a moment's notice. Track the value in your watchlist or portfolio and be alerted on when to act.
Approach 2: Woodward Price vs Earnings
For profitable companies like Woodward, the price to earnings, or PE, ratio is a straightforward way to see how much investors are paying for each dollar of current profit. It naturally links today’s share price to the earnings power that ultimately supports returns over time.
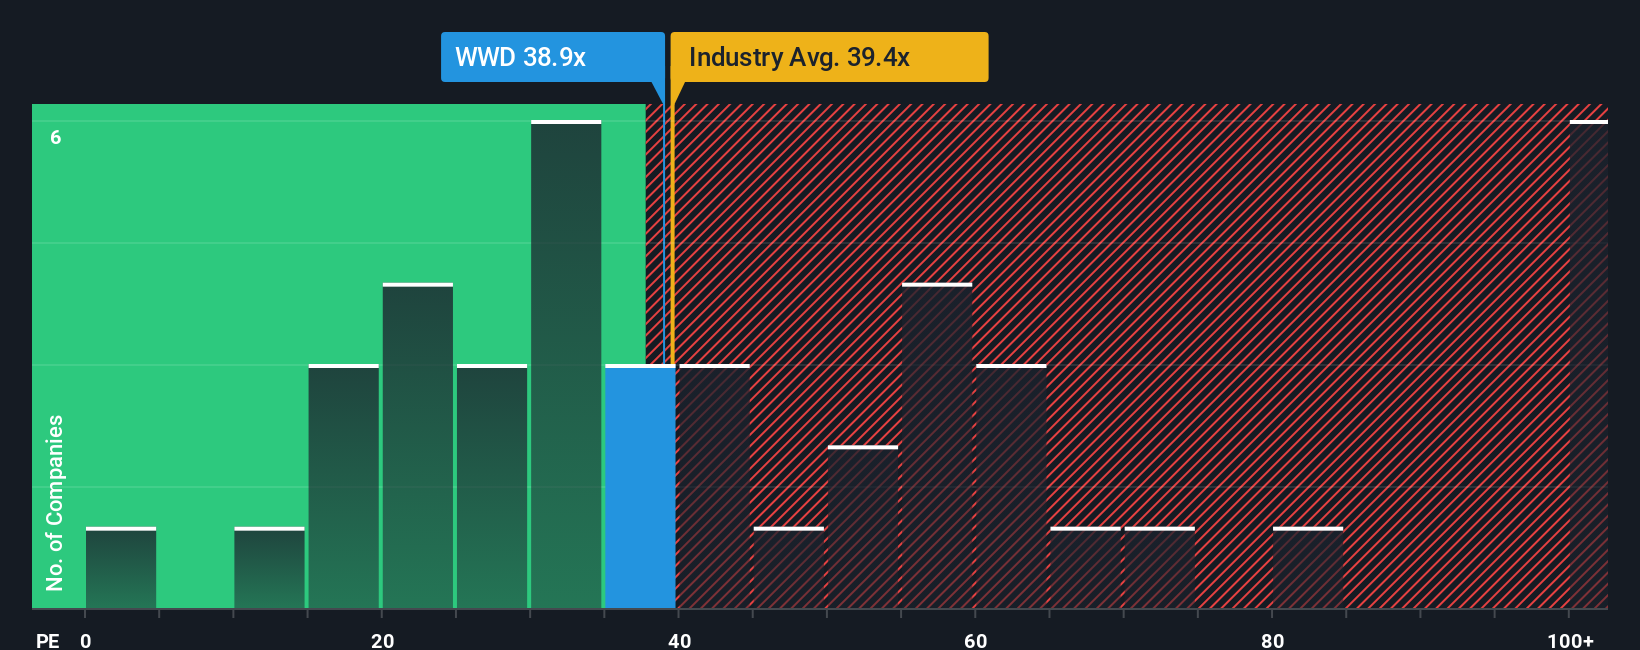
What counts as a normal or fair PE depends on how fast earnings are expected to grow and how risky those earnings are. Faster, more reliable growth usually justifies a higher PE, while slower or more volatile earnings tend to deserve a lower one. Woodward currently trades on a PE of about 39.0x, above both the Aerospace and Defense industry average of roughly 36.2x and the peer average of about 37.4x, suggesting the market is assigning it a premium.
Simply Wall St’s Fair Ratio framework goes a step further by estimating what PE Woodward should trade on, given its earnings growth outlook, profitability, risk profile, industry and market cap. That Fair Ratio comes out at around 26.5x, well below the current 39.0x multiple, indicating that even after factoring in its strengths the stock screens as meaningfully expensive on earnings.
Result: OVERVALUED
PE ratios tell one story, but what if the real opportunity lies elsewhere? Discover 1450 companies where insiders are betting big on explosive growth.
Upgrade Your Decision Making: Choose your Woodward Narrative
Earlier we mentioned that there is an even better way to understand valuation, so let us introduce you to Narratives, which connect the story you believe about a company with a simple financial forecast and a fair value estimate you can compare to today’s share price.
A Narrative on Simply Wall St is your structured way of saying, “Here is how I think Woodward’s revenue, earnings and margins will evolve, and here is the price that story adds up to,” turning your view of its competitive position, risks and opportunities into concrete numbers.
Within the Community page on Simply Wall St, used by millions of investors, Narratives are easy to create and track. They update dynamically as fresh information like earnings reports, guidance or news about new facilities and buybacks is released.
This means you can quickly see when your Narrative’s fair value moves above or below the actual share price. You can then decide whether Woodward looks like a buy, a hold or a sell based on your own assumptions rather than just headline multiples.
For example, one Woodward Narrative might see upside toward around $335 per share on strong execution and margin expansion. A more cautious Narrative could anchor closer to $245 if capital intensity, technological disruption and end market volatility weigh more heavily on the outlook.
Do you think there's more to the story for Woodward? Head over to our Community to see what others are saying!
This article by Simply Wall St is general in nature. We provide commentary based on historical data and analyst forecasts only using an unbiased methodology and our articles are not intended to be financial advice. It does not constitute a recommendation to buy or sell any stock, and does not take account of your objectives, or your financial situation. We aim to bring you long-term focused analysis driven by fundamental data. Note that our analysis may not factor in the latest price-sensitive company announcements or qualitative material. Simply Wall St has no position in any stocks mentioned.
Have feedback on this article? Concerned about the content? Get in touch with us directly. Alternatively, email editorial-team@simplywallst.com