
Is Eurofins Scientific Fairly Priced After Portfolio Streamlining and 2025 Share Price Rebound?
- If you have been wondering whether Eurofins Scientific is still a quality stock at a fair price, you are not alone, as many investors are trying to figure out if the current share price matches its long term potential.
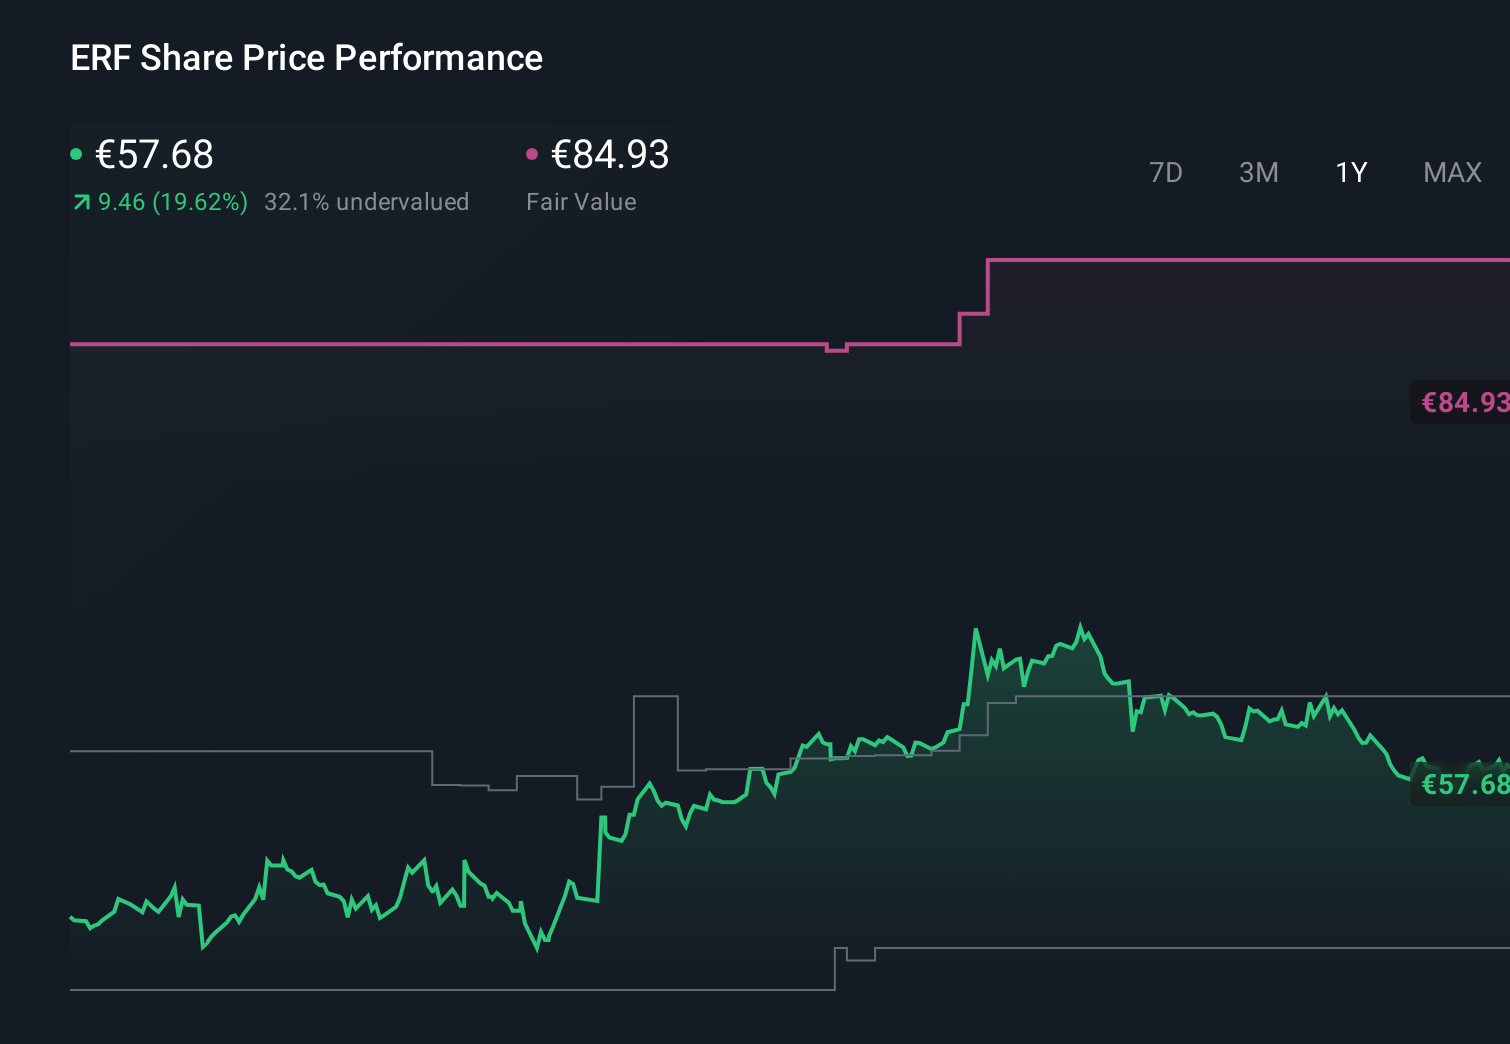
- Despite a choppy few weeks, with the share price down 4.4% over the last 7 days and 2.6% over the last month, Eurofins is still up 16.3% year to date and 20.2% over the past year. This hints that the market may be warming back up to its story after a tougher 3 and 5 year stretch.
- Recent headlines have focused on Eurofins streamlining its portfolio and doubling down on core testing and laboratory services. Investors often read these moves as a sign of management discipline and a push for higher returns. Alongside that, the company has continued to expand in high demand areas like environmental, food safety and clinical diagnostics, giving the market more reasons to reassess its long term growth runway.
- On our checks Eurofins scores a 4/6 valuation score, suggesting it looks undervalued on several fronts. In the next sections we will break that down across different valuation methods before finishing with a more nuanced way to think about what the stock is really worth.
Approach 1: Eurofins Scientific Discounted Cash Flow (DCF) Analysis
A Discounted Cash Flow model estimates what a business is worth by projecting the cash it can generate in the future and discounting those cash flows back to today, using a required rate of return.
For Eurofins Scientific, the latest twelve month Free Cash Flow is about €717.5 million. Analysts provide detailed forecasts for the next few years, and beyond that Simply Wall St extrapolates those trends. This results in an estimated Free Cash Flow of roughly €957.3 million by 2035. These projections assume moderate, slowing growth as the company matures.
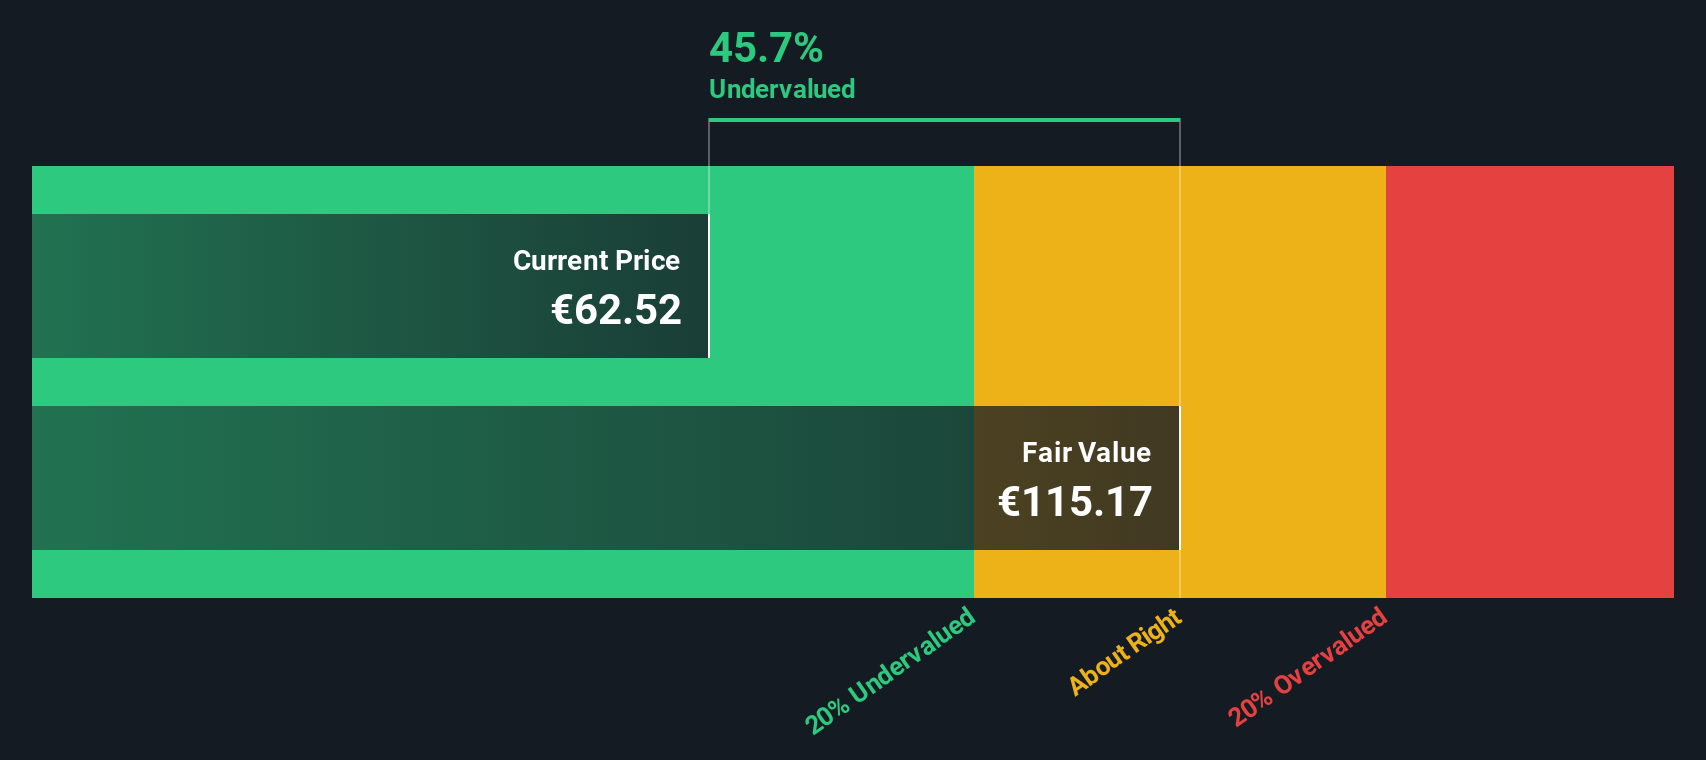
Aggregating and discounting these future cash flows under a 2 Stage Free Cash Flow to Equity model gives an estimated intrinsic value of about €91.16 per share. Compared to the current market price, this implies the shares trade at a 37.8% discount. This suggests the market is still skeptical about the durability of Eurofins growth and cash generation.
Result: UNDERVALUED
Our Discounted Cash Flow (DCF) analysis suggests Eurofins Scientific is undervalued by 37.8%. Track this in your watchlist or portfolio, or discover 894 more undervalued stocks based on cash flows.
Approach 2: Eurofins Scientific Price vs Earnings
Price to earnings is a useful yardstick for valuing profitable companies because it ties what investors are paying directly to the earnings the business is already generating. In general, faster growth and lower risk justify a higher PE ratio, while slower or more uncertain growth tends to warrant a lower multiple.
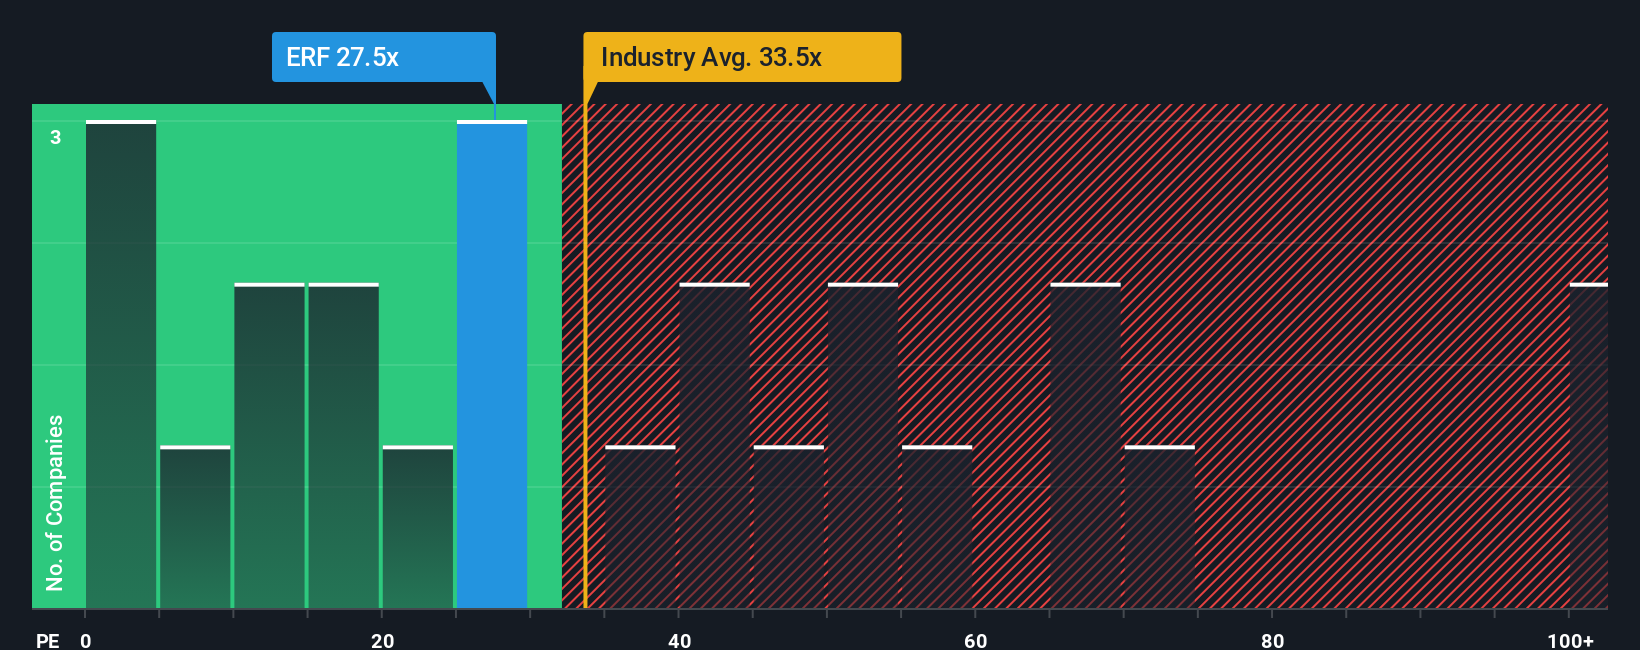
Eurofins Scientific currently trades on a PE of about 26.4x. This sits below both the Life Sciences industry average of roughly 34.1x and the peer group average of around 33.6x, suggesting the market prices Eurofins more cautiously than many of its closest comparables.
Simply Wall St also calculates a proprietary Fair Ratio of 19.3x, which represents the PE you might expect for Eurofins given its earnings growth outlook, profitability, industry, market cap and risk profile. This approach is more tailored than a simple peer or industry comparison, because it adjusts for company specific strengths and weaknesses rather than assuming all firms deserve the same multiple. With Eurofins trading at 26.4x versus a Fair Ratio of 19.3x, the shares look somewhat expensive on this metric.
Result: OVERVALUED
PE ratios tell one story, but what if the real opportunity lies elsewhere? Discover 1450 companies where insiders are betting big on explosive growth.
Upgrade Your Decision Making: Choose your Eurofins Scientific Narrative
Earlier we mentioned that there is an even better way to understand valuation, so let us introduce you to Narratives, a simple way to connect your view of Eurofins Scientific future with the numbers behind its fair value. A Narrative is your story about the company, where you spell out what you think will happen to its revenue, earnings and margins, and then translate that into a financial forecast and an estimated fair value. On Simply Wall St, millions of investors build and share these Narratives on the Community page, making it easy and accessible to see how different stories lead to different valuations and decisions about when to buy or sell, by comparing each Narrative Fair Value with the current market price. Narratives also stay alive in real time, automatically updating when new information, such as earnings results or major news, changes the outlook. For example, one Eurofins Narrative might lean bullish, assuming successful integration of acquisitions, margin expansion to around 8.5 percent and a fair value near €95, while another more cautious Narrative might focus on execution risks, softer growth and a fair value closer to €46.
Do you think there's more to the story for Eurofins Scientific? Head over to our Community to see what others are saying!
This article by Simply Wall St is general in nature. We provide commentary based on historical data and analyst forecasts only using an unbiased methodology and our articles are not intended to be financial advice. It does not constitute a recommendation to buy or sell any stock, and does not take account of your objectives, or your financial situation. We aim to bring you long-term focused analysis driven by fundamental data. Note that our analysis may not factor in the latest price-sensitive company announcements or qualitative material. Simply Wall St has no position in any stocks mentioned.
Have feedback on this article? Concerned about the content? Get in touch with us directly. Alternatively, email editorial-team@simplywallst.com