
Is It Too Late To Consider Ellington Financial After Its Strong 2025 Share Price Rally?
- If you are wondering whether Ellington Financial still offers good value after a strong run, or if most of the upside is already priced in, this article will walk you through what the numbers indicate.
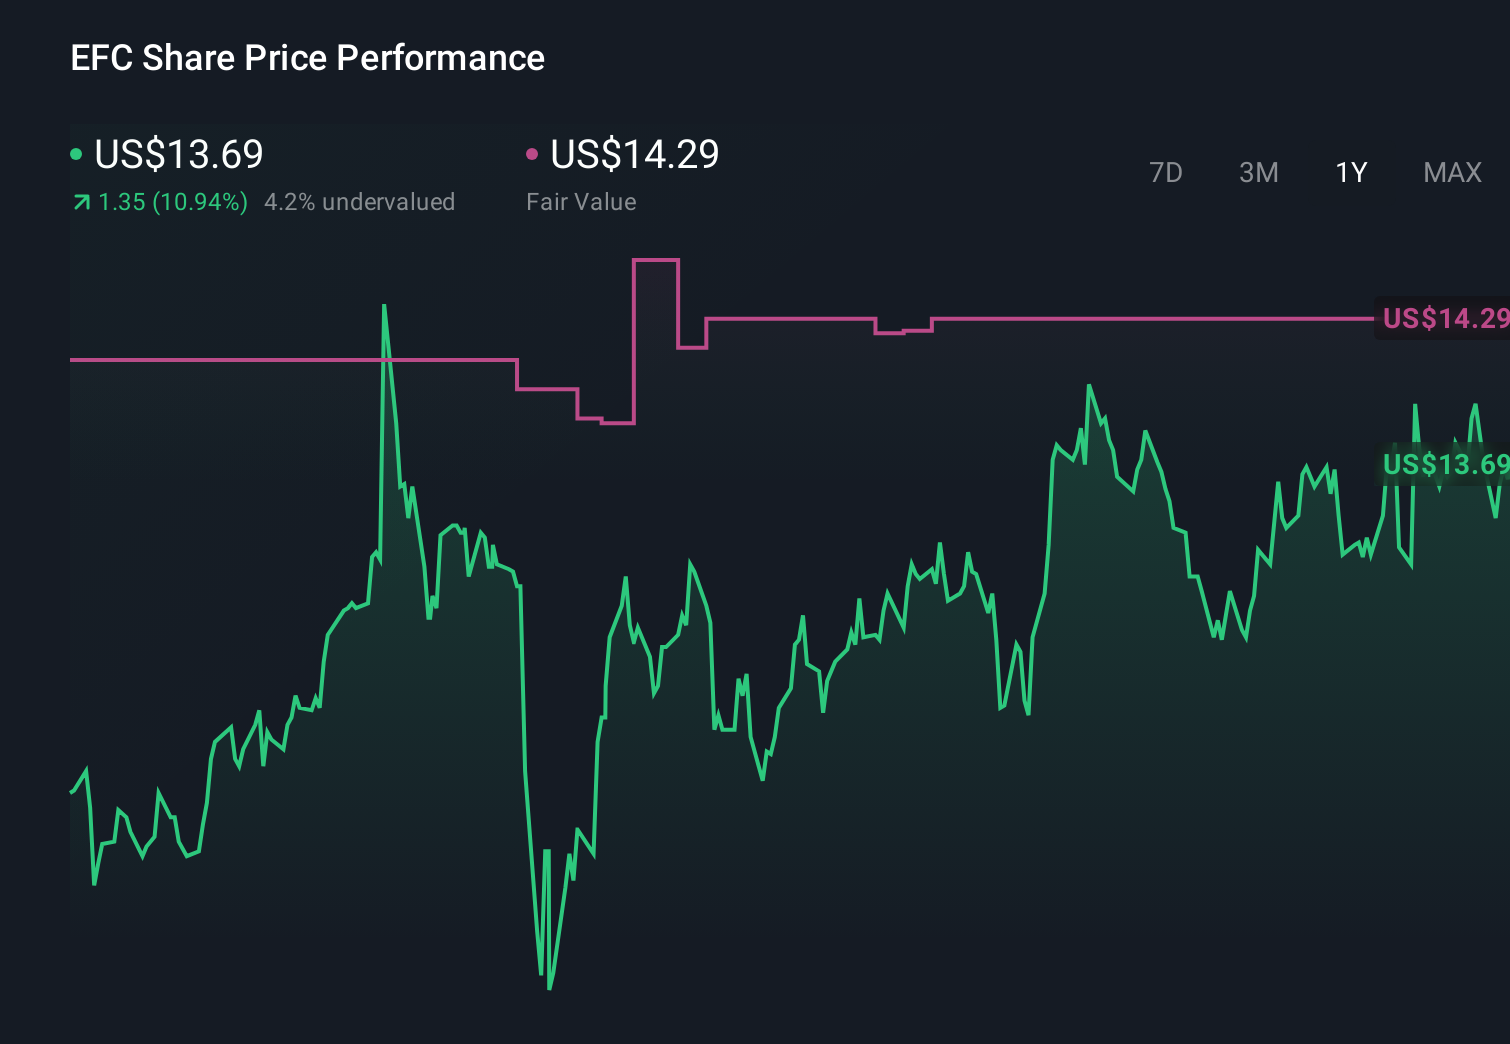
- The stock has climbed 24.1% over the last year and is up 11.6% year to date, even after a mild 0.8% pullback over the last week and a steady 2.2% gain over the past month.
- Recent headlines have focused on Ellington Financial’s active portfolio repositioning and capital allocation moves. These developments help explain why investors have been re-rating the stock. Coverage has also highlighted the company’s focus on navigating higher rate environments, providing context for both its improved sentiment and the risks the market is considering.
- On our valuation framework, Ellington Financial scores a 5/6 for being undervalued across key checks. We will break down what that means using several common valuation approaches, and then conclude with a more holistic way to think about its overall worth.
Approach 1: Ellington Financial Excess Returns Analysis
The Excess Returns model looks at how effectively Ellington Financial turns its equity base into profits above the return investors require. Instead of focusing on cash flows, it values the stock by comparing the company’s expected profitability on its equity with its cost of equity.
Ellington Financial has a Book Value of $13.52 per share and a Stable EPS of $1.72 per share, based on weighted future Return on Equity estimates from 4 analysts. With an Average Return on Equity of 12.33% against a Cost of Equity of $1.28 per share, the model calculates an Excess Return of $0.44 per share. The Stable Book Value is projected at $13.93 per share, based on estimates from 5 analysts, suggesting a reasonably steady capital base.
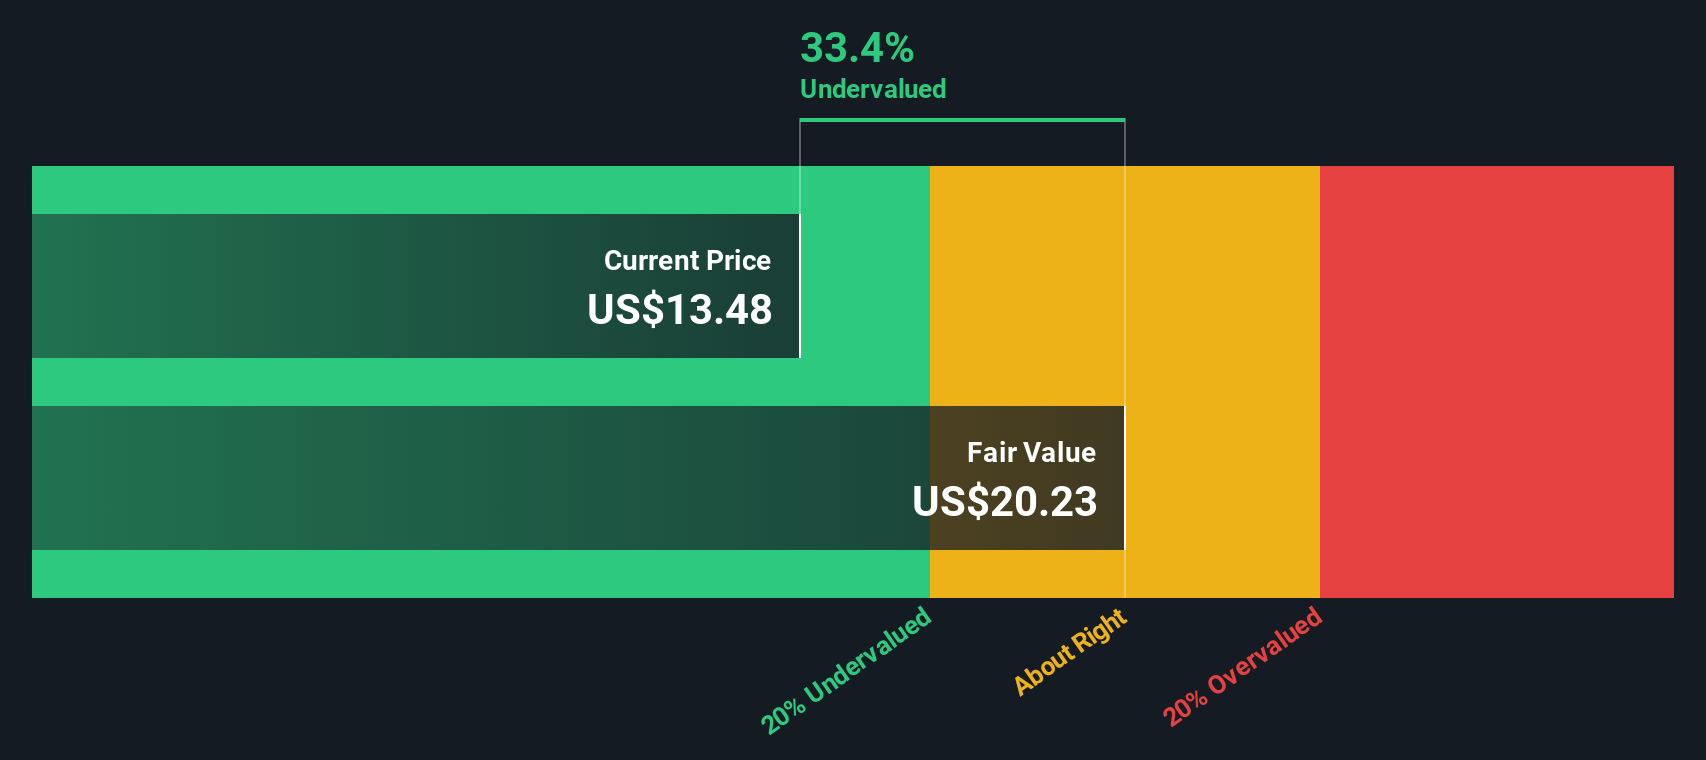
Combining these inputs, the Excess Returns valuation implies an intrinsic value of about $21.36 per share, indicating the stock is roughly 36.5% below its current trading level. In other words, the market is not fully pricing in the forecast return on Ellington Financial’s equity.
Result: UNDERVALUED
Our Excess Returns analysis suggests Ellington Financial is undervalued by 36.5%. Track this in your watchlist or portfolio, or discover 894 more undervalued stocks based on cash flows.
Approach 2: Ellington Financial Price vs Earnings
For a profitable company like Ellington Financial, the price to earnings ratio is a useful yardstick because it links what investors are paying directly to the profits the business is generating today. In general, companies with stronger, more reliable growth and lower perceived risk can justify higher PE ratios, while slower growing or riskier names tend to trade on lower multiples.
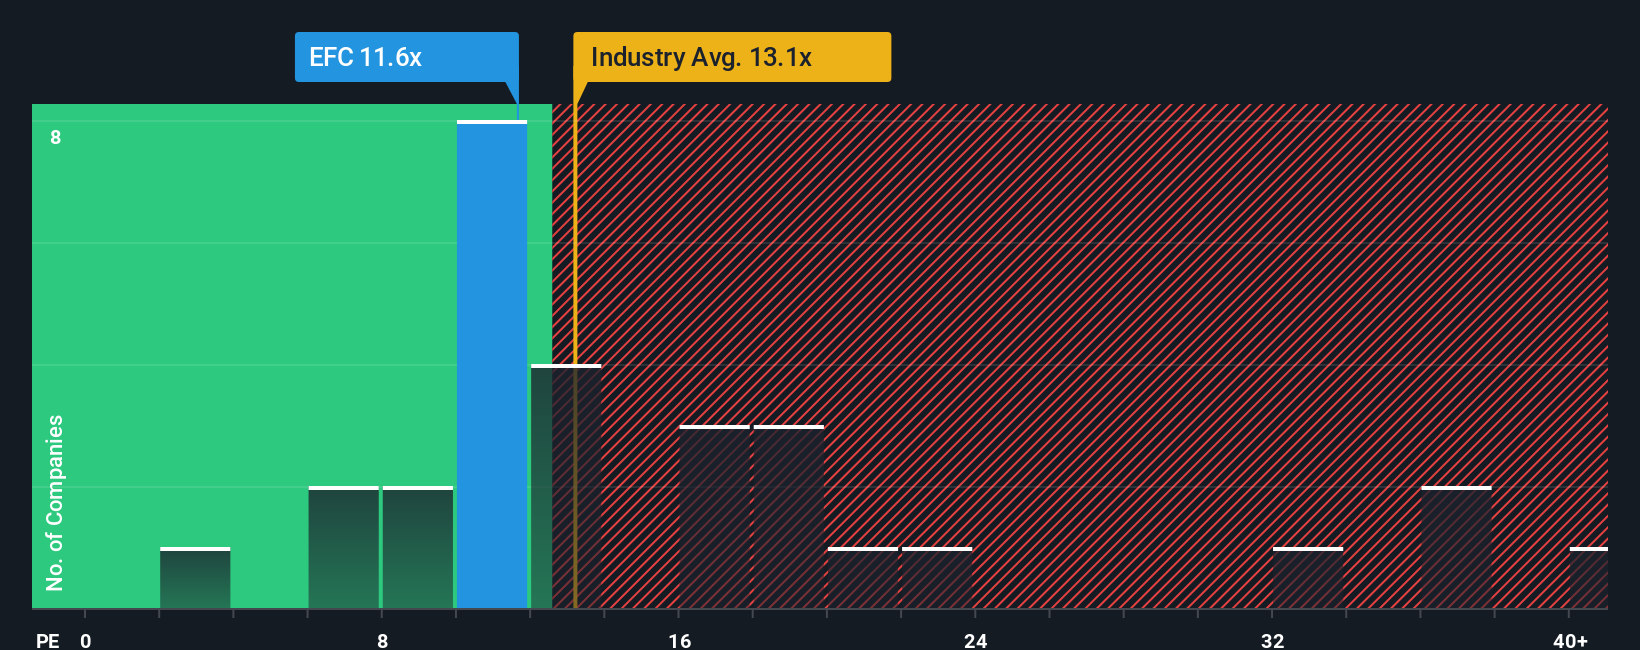
Ellington Financial currently trades on a PE of 11.52x, which sits below both the Mortgage REITs industry average of about 13.05x and the broader peer group average of 18.01x. On the surface, that discount suggests the market is more cautious about Ellington Financial’s outlook than it is about many of its peers.
Simply Wall St’s Fair Ratio framework goes a step further by estimating what PE multiple would be reasonable given Ellington Financial’s specific earnings growth profile, risk characteristics, profitability, industry positioning and market cap. For Ellington Financial, this Fair Ratio is 13.48x, implying the shares could trade closer to this level than where they are now. Because the current 11.52x is meaningfully below the 13.48x Fair Ratio, the stock screens as attractively priced on this metric.
Result: UNDERVALUED
PE ratios tell one story, but what if the real opportunity lies elsewhere? Discover 1450 companies where insiders are betting big on explosive growth.
Upgrade Your Decision Making: Choose your Ellington Financial Narrative
Earlier we mentioned that there is an even better way to understand valuation, so let us introduce you to Narratives, which are simple stories that capture your view of Ellington Financial’s future, link that story to explicit forecasts for revenue, earnings and margins, and then convert those forecasts into a Fair Value you can compare with today’s share price to help inform a decision to buy, hold or sell.
On Simply Wall St’s Community page, you can quickly create or explore Narratives for Ellington Financial. These will update dynamically as new earnings reports, news or industry data emerge so your fair value view stays in sync with reality instead of going stale.
For example, one investor might build a bullish Narrative that assumes Ellington fully capitalizes on demographic tailwinds and technology advantages to support revenues near the higher end of current expectations and a fair value closer to 16 dollars. A more cautious investor could focus on credit and funding risks, assume weaker growth and pressure on margins, and arrive at a fair value nearer 13.5 dollars.
Do you think there's more to the story for Ellington Financial? Head over to our Community to see what others are saying!
This article by Simply Wall St is general in nature. We provide commentary based on historical data and analyst forecasts only using an unbiased methodology and our articles are not intended to be financial advice. It does not constitute a recommendation to buy or sell any stock, and does not take account of your objectives, or your financial situation. We aim to bring you long-term focused analysis driven by fundamental data. Note that our analysis may not factor in the latest price-sensitive company announcements or qualitative material. Simply Wall St has no position in any stocks mentioned.
Have feedback on this article? Concerned about the content? Get in touch with us directly. Alternatively, email editorial-team@simplywallst.com