
Is It Too Late To Invest In Trane After Its Multi Year Rally And Recent Pullback
- If you are wondering whether Trane Technologies at around $399 is still worth considering after its significant multi year run, or if you are arriving too late to benefit, you are in the right place.
- The stock is up an impressive 134.1% over 3 years and 207.5% over 5 years. More recently it has pulled back, with a 6.7% gain year to date, but a 2.5% drop in the last week and an 8.0% decline over the last month.
- This combination of long term strength and short term cooling has come as investors refocus on themes such as building efficiency, decarbonization and climate control solutions. Trane is often viewed as a key player in these areas. Policy support for greener infrastructure and ongoing demand for energy efficient HVAC systems are shaping expectations for the company, even as the share price consolidates.
- Right now, Trane Technologies has a 2/6 valuation check score. This suggests it appears undervalued on only a couple of standard metrics. The more important question is what different valuation approaches indicate when considered together, and whether there is a more effective way to interpret those signals, which will be explored by the end of this article.
Trane Technologies scores just 2/6 on our valuation checks. See what other red flags we found in the full valuation breakdown.
Approach 1: Trane Technologies Discounted Cash Flow (DCF) Analysis
A Discounted Cash Flow (DCF) model estimates what a company is worth today by projecting its future cash flows and discounting them back to the present using a required return.
For Trane Technologies, the model starts with last twelve months Free Cash Flow of about $2.56 billion. Analysts then forecast cash flows several years ahead, including around $3.18 billion in 2026 and $3.88 billion by 2028. Beyond the analyst window, Simply Wall St extrapolates further, with projected Free Cash Flow reaching roughly $5.39 billion by 2035, assuming moderating growth as the business matures.
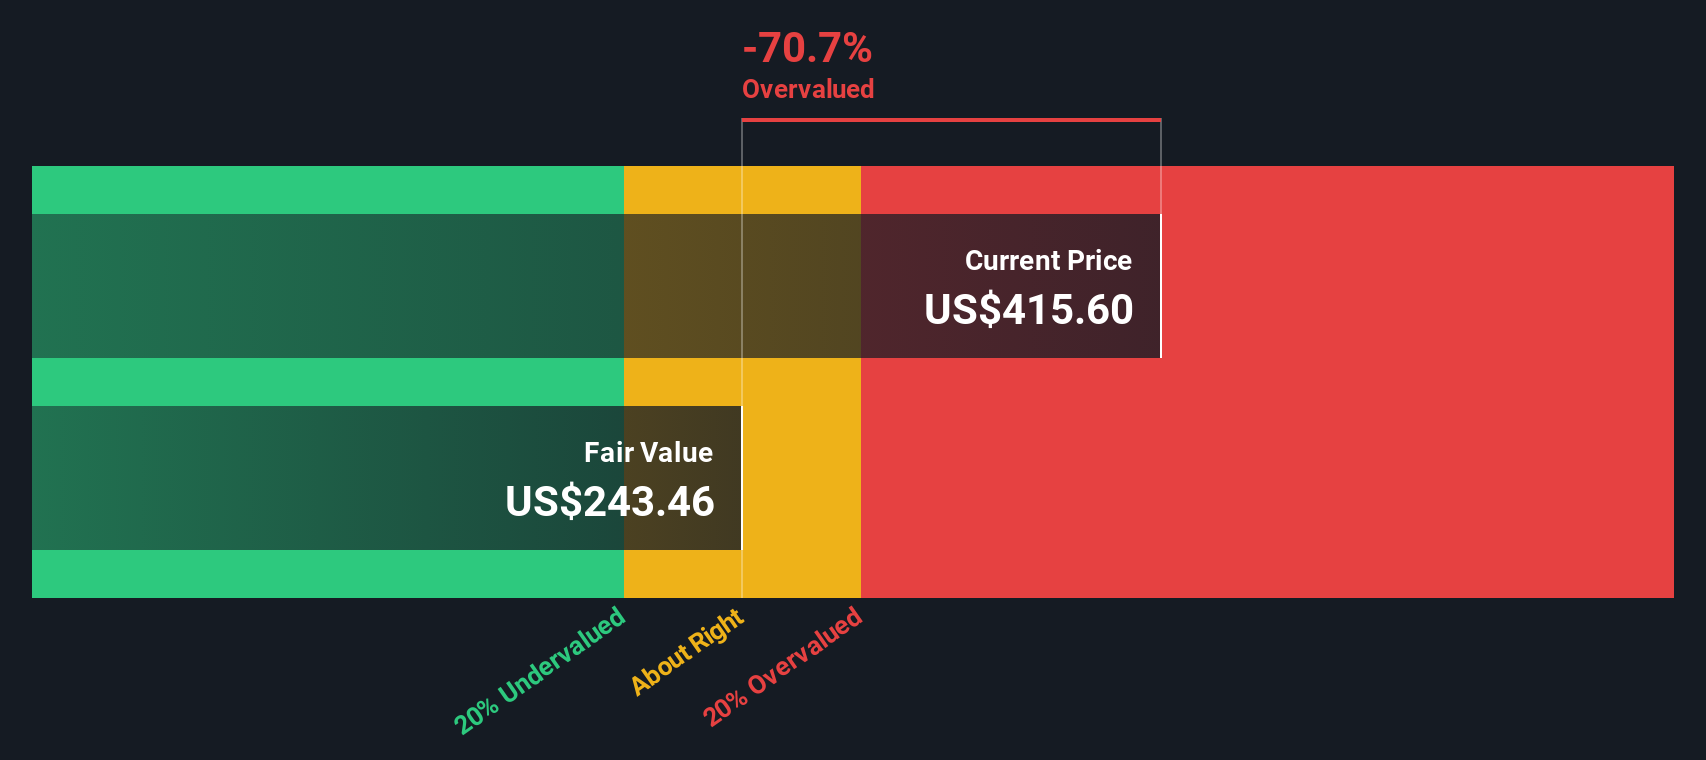
When all these projected cash flows are discounted back and summed under a 2 Stage Free Cash Flow to Equity model, the estimated intrinsic value comes out at roughly $308 per share. With the stock trading around $399, the DCF suggests Trane is about 29.4% overvalued on this basis. This implies the current price already incorporates optimistic long term expectations.
Result: OVERVALUED
Our Discounted Cash Flow (DCF) analysis suggests Trane Technologies may be overvalued by 29.4%. Discover 895 undervalued stocks or create your own screener to find better value opportunities.
Approach 2: Trane Technologies Price vs Earnings
For a profitable, established business like Trane Technologies, the price to earnings, or PE, ratio is a practical way to gauge valuation because it directly links what investors pay to the company’s current earning power. In broad terms, faster growing and lower risk companies usually justify a higher, or more expensive, PE multiple, while slower growth or higher risk typically demand a discount.
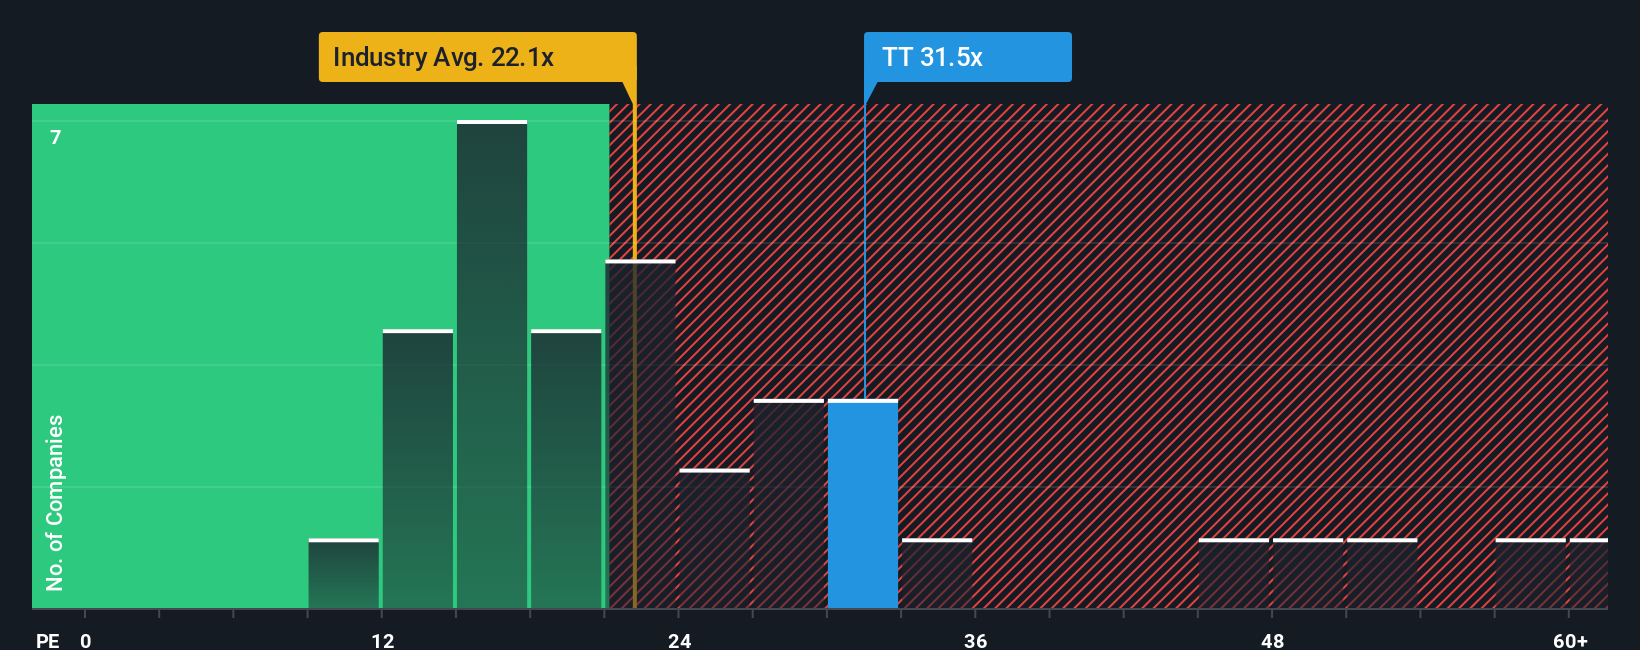
Trane currently trades on a PE of about 30.0x. That is well above the broader Building industry average of roughly 19.0x, and also a touch higher than the peer group average of around 28.9x, suggesting the market already assigns Trane a premium. Simply Wall St’s Fair Ratio framework goes a step further by estimating what PE multiple the stock should trade on, given its earnings growth outlook, profitability, industry positioning, market capitalization and specific risks.
Because this Fair Ratio for Trane comes out at about 30.4x, it implies that, once those company specific factors are accounted for, today’s premium is broadly justified rather than excessive. On this multiple based lens, the stock looks close to fairly valued rather than clearly cheap or expensive.
Result: ABOUT RIGHT
PE ratios tell one story, but what if the real opportunity lies elsewhere? Discover 1450 companies where insiders are betting big on explosive growth.
Upgrade Your Decision Making: Choose your Trane Technologies Narrative
Earlier we mentioned that there is an even better way to understand valuation, so let us introduce you to Narratives, a simple way to connect your view of a company with the numbers behind it.
A Narrative is your story about a business, expressed as assumptions about its future revenue, earnings, and margins, which then flow through to a forecast and an implied fair value.
On Simply Wall St’s Community page, Narratives are an easy tool used by millions of investors to link a company’s story to a financial model, compare that fair value to today’s price, and decide whether it looks like a buy, hold, or sell.
Because Narratives are updated dynamically when new information comes in, your fair value can automatically reflect fresh news, earnings results, or guidance without you needing to rebuild a spreadsheet.
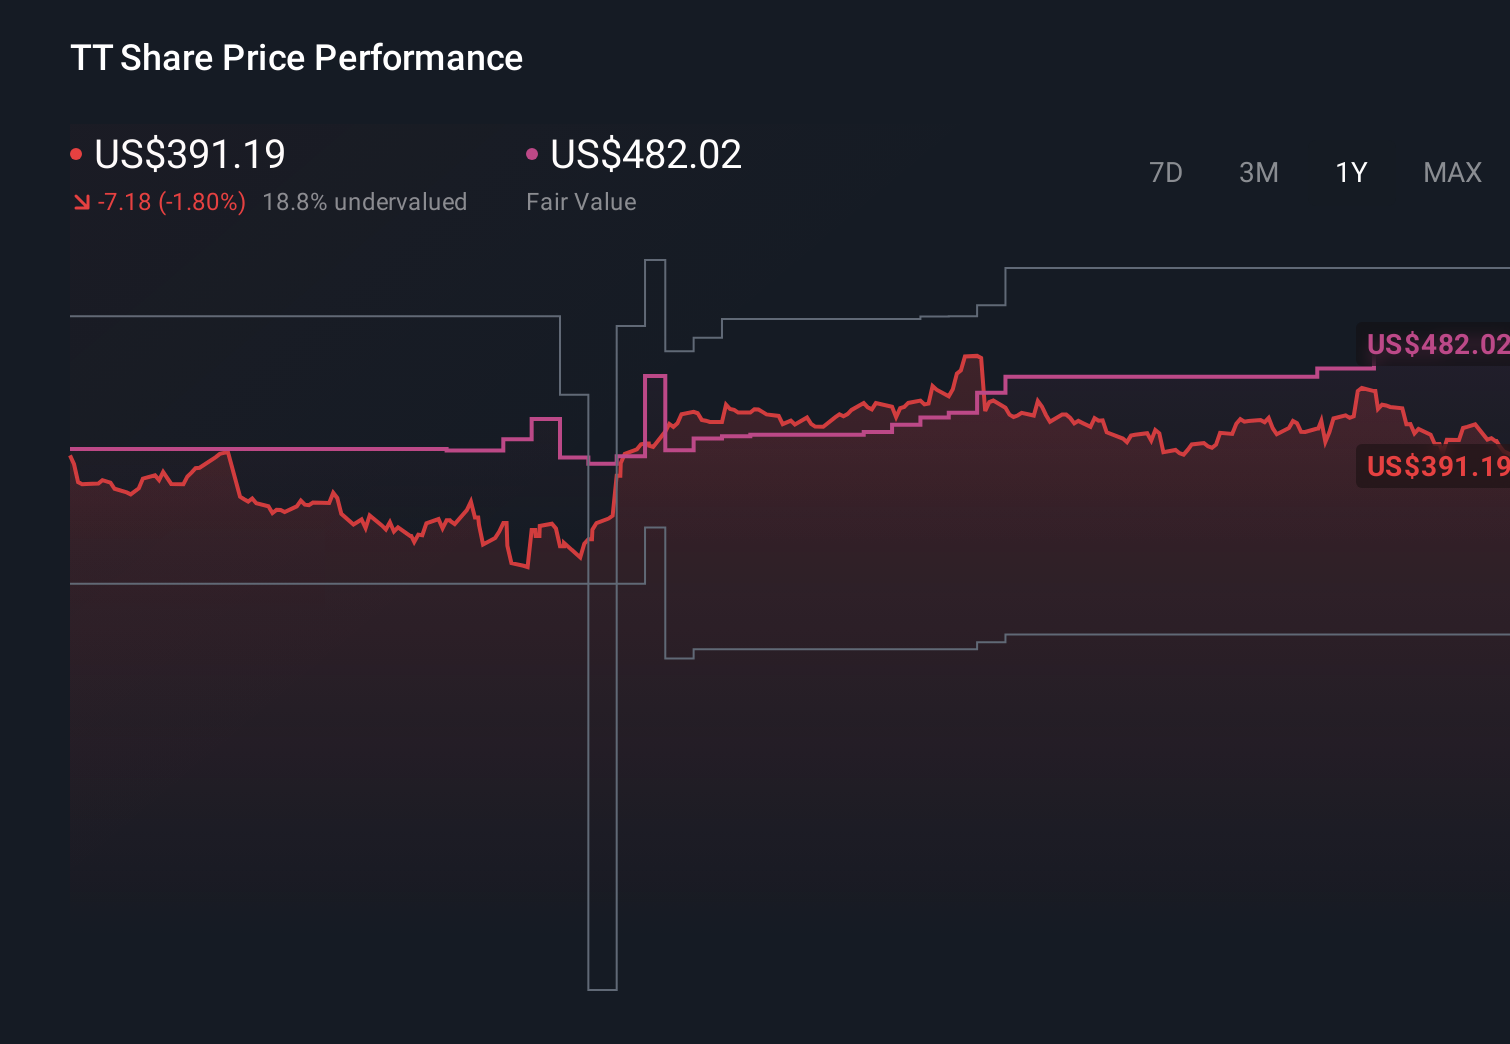
For Trane Technologies, for example, one investor might build a bullish Narrative that assumes AI driven building solutions support margins and justify a fair value around $482 per share. A more cautious investor might emphasize transport market headwinds and arrive at a fair value closer to $265.00, and both can instantly see how their story compares to the current share price.
Do you think there's more to the story for Trane Technologies? Head over to our Community to see what others are saying!
This article by Simply Wall St is general in nature. We provide commentary based on historical data and analyst forecasts only using an unbiased methodology and our articles are not intended to be financial advice. It does not constitute a recommendation to buy or sell any stock, and does not take account of your objectives, or your financial situation. We aim to bring you long-term focused analysis driven by fundamental data. Note that our analysis may not factor in the latest price-sensitive company announcements or qualitative material. Simply Wall St has no position in any stocks mentioned.
Have feedback on this article? Concerned about the content? Get in touch with us directly. Alternatively, email editorial-team@simplywallst.com