
Has PVH’s 27% 2025 Slide Created a Value Opportunity for Investors?
- If you are wondering whether PVH is starting to look like a bargain after a rough stretch or if it is cheap for a reason, you are not alone. This is exactly the kind of setup where valuation work really matters.
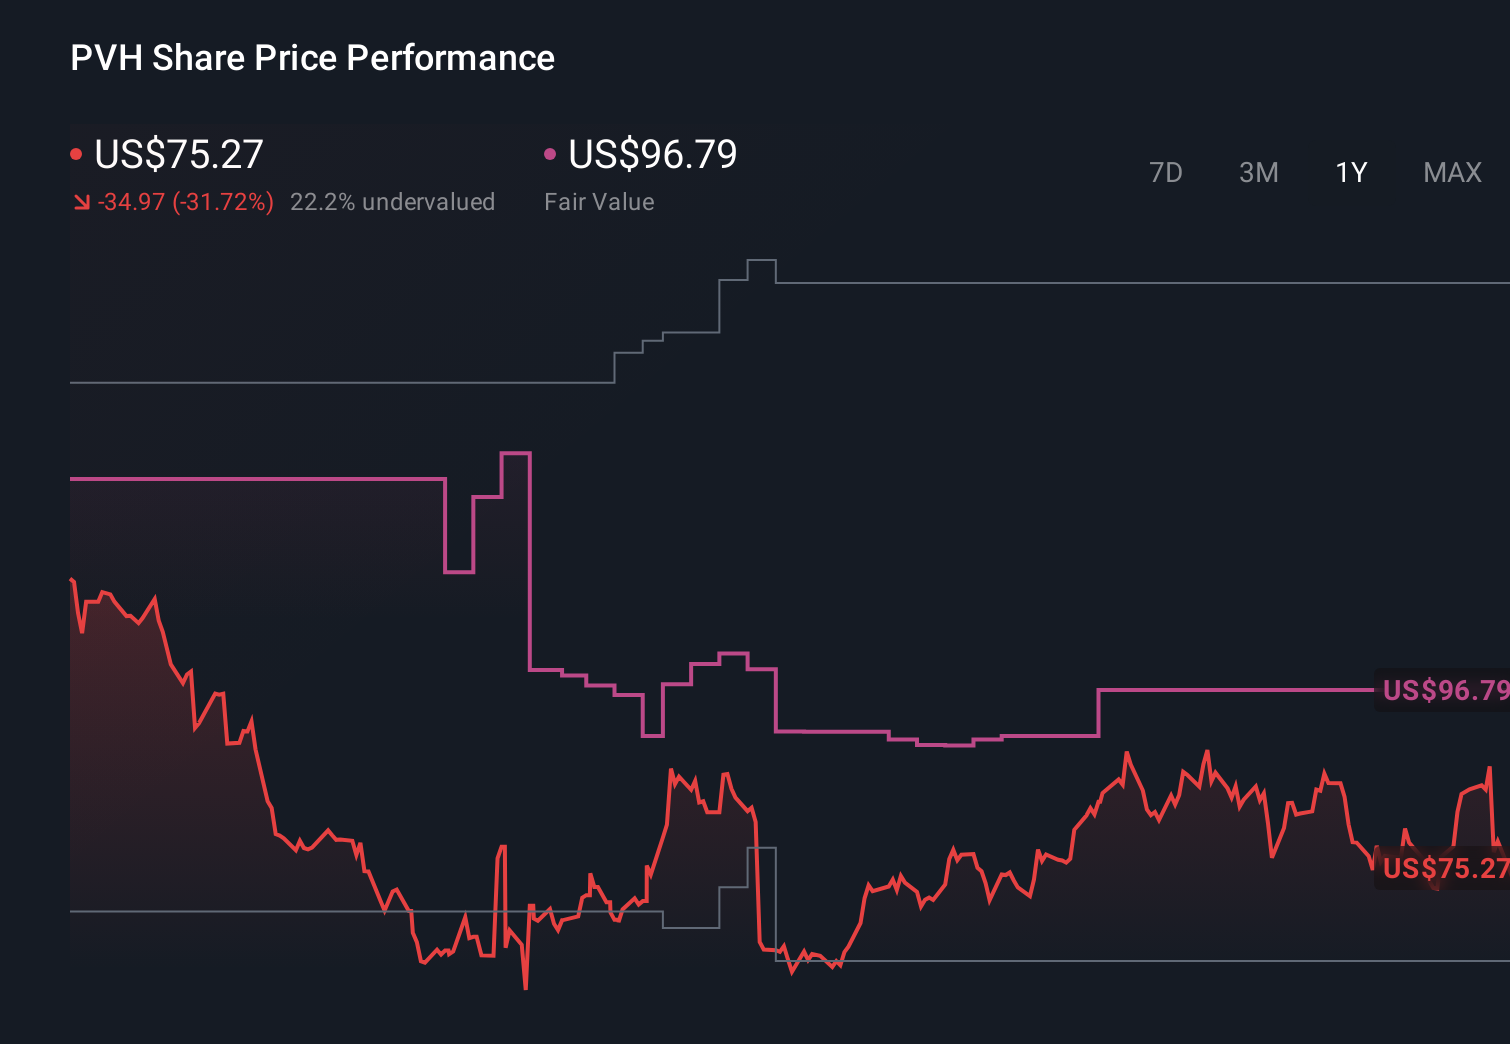
- The stock has slipped to around $76.12 after a 13.1% drop over the last week and is now down 27.4% year to date and 30.5% over the last year, shifting many investors from growth optimism to value hunting mode.
- Recent market chatter has focused on how PVH is navigating a tougher consumer environment and reshaping its brand mix, particularly around Calvin Klein and Tommy Hilfiger, as it leans harder into higher margin and direct to consumer channels. At the same time, analysts and investors are debating whether the company is being overly punished compared to other global apparel names facing similar headwinds.
- Despite that gloomy share price, PVH scores a 5/6 on our valuation checks. This suggests the market may be underestimating the business on multiple fronts. Next we will walk through the standard valuation approaches before finishing with a more powerful way to think about PVH’s true worth.
Find out why PVH's -30.5% return over the last year is lagging behind its peers.
Approach 1: PVH Discounted Cash Flow (DCF) Analysis
The Discounted Cash Flow model works by projecting a company’s future cash flows and then discounting them back to today’s value, giving an estimate of what the business is worth in total.
For PVH, the latest twelve month Free Cash Flow stands at about $387 million. Analyst and model projections used in this 2 Stage Free Cash Flow to Equity model show cash flows rising into the mid to high $500 million range over the coming years, with forecast Free Cash Flow around $583 million by 2030. Estimates for the next five years are based on analyst expectations, while later years are extrapolated to extend the cash flow curve.
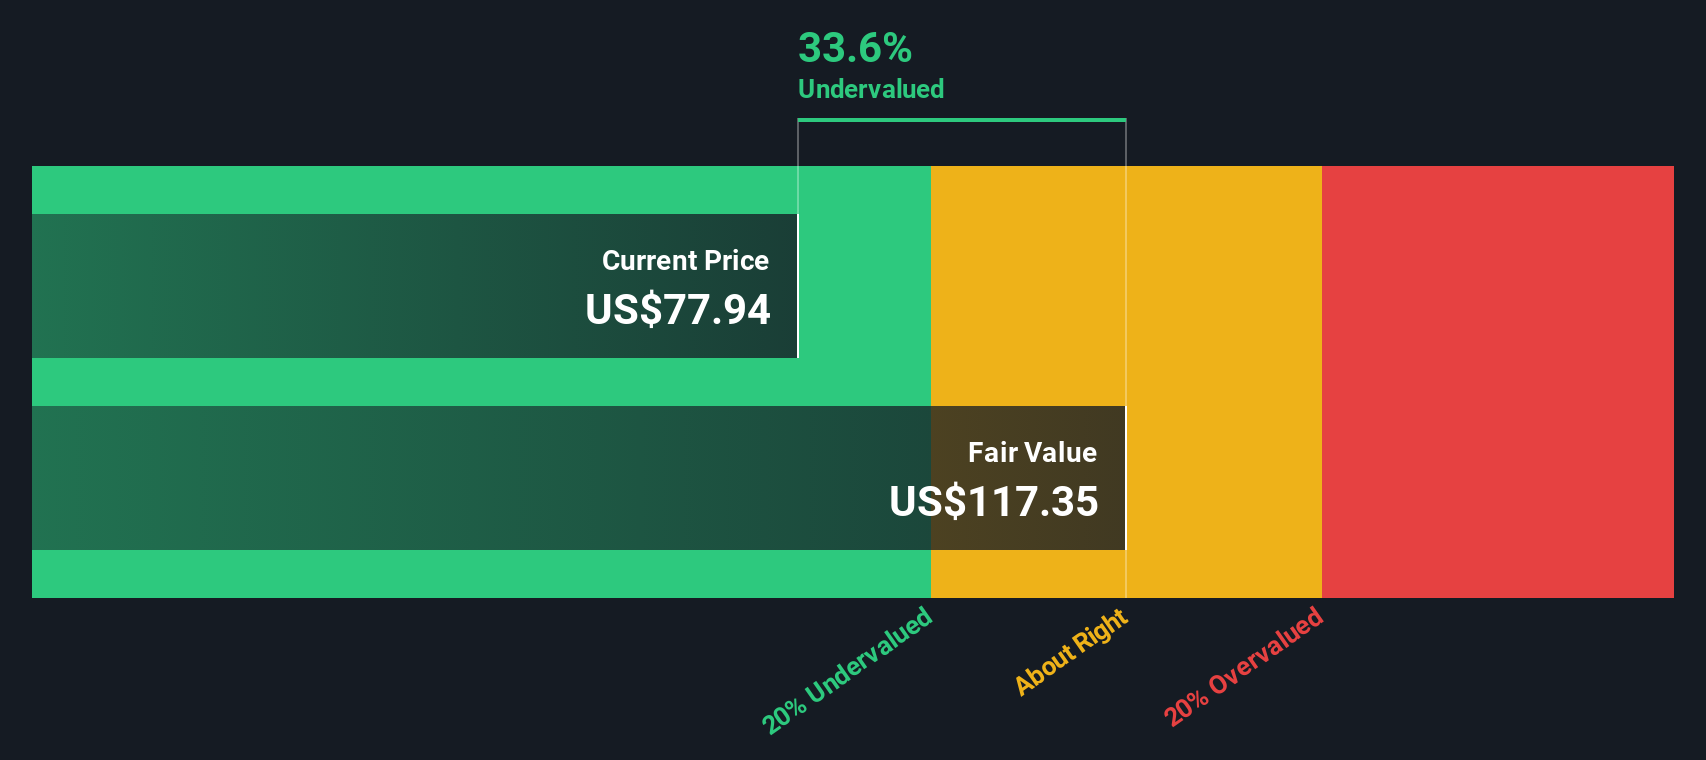
When these projected cash flows are discounted back, the model arrives at an intrinsic value of roughly $118.94 per share. Compared with the current share price near $76, the DCF suggests PVH is about 36.0% undervalued, based on these assumptions.
Result: UNDERVALUED
Our Discounted Cash Flow (DCF) analysis suggests PVH is undervalued by 36.0%. Track this in your watchlist or portfolio, or discover 895 more undervalued stocks based on cash flows.
Approach 2: PVH Price vs Earnings
For a consistently profitable business like PVH, the Price to Earnings (PE) ratio is a practical way to gauge how much investors are willing to pay for each dollar of current earnings. In general, companies with stronger growth prospects and lower risk profiles tend to justify a higher PE, while slower growth or higher uncertainty usually calls for a lower, more conservative multiple.
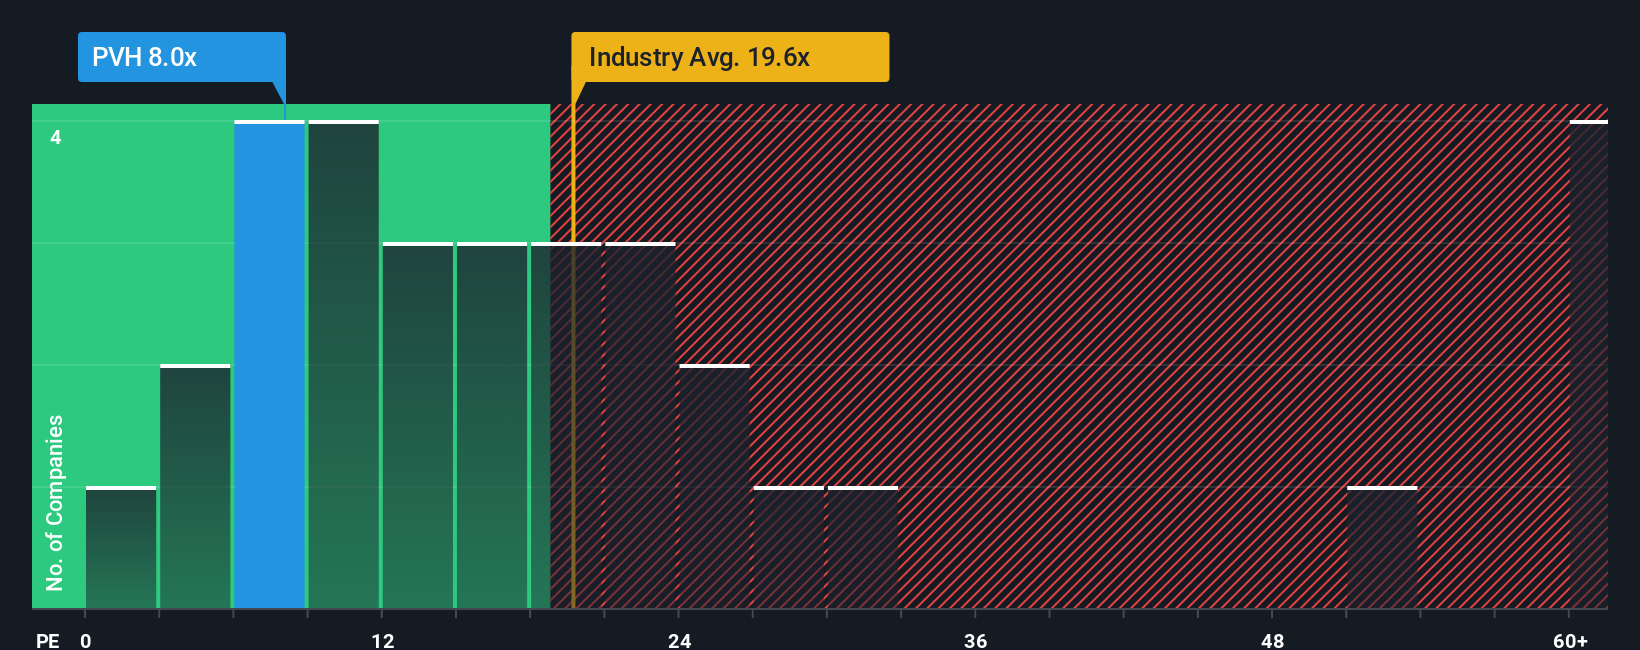
PVH currently trades at about 10.23x earnings, which is well below the Luxury industry average of roughly 20.95x and the broader peer group average near 33.29x. Simply Wall St’s proprietary Fair Ratio model, which estimates what a “normal” PE should be after factoring in PVH’s earnings growth outlook, profit margins, risk profile, industry positioning and market cap, suggests a fair PE closer to 19.63x. This Fair Ratio is more informative than a simple comparison with peers or industry averages because it adjusts for the company’s specific fundamentals rather than assuming all luxury stocks deserve the same multiple. With PVH’s actual PE sitting meaningfully below this fair level, the multiple-based view points to the shares still being undervalued.
Result: UNDERVALUED
PE ratios tell one story, but what if the real opportunity lies elsewhere? Discover 1450 companies where insiders are betting big on explosive growth.
Upgrade Your Decision Making: Choose your PVH Narrative
Earlier we mentioned that there is an even better way to understand valuation, so let us introduce you to Narratives, a more powerful and dynamic way to invest that connects the story you believe about PVH to a concrete forecast and fair value estimate. A Narrative on Simply Wall St is your structured storyline for a company, where you spell out how you think its revenue, earnings and margins will evolve, and the platform turns that into a financial forecast and an implied fair value you can compare to today’s price to inform whether you buy, hold or sell. Narratives live in the Community section used by millions of investors, and they are kept up to date as new information such as earnings, guidance changes or major news flows in. This means your fair value view adjusts with the facts rather than staying static. For PVH, one Narrative might lean into expansion in Asia and margin gains and land near the higher analyst fair value around $148. In contrast, a more cautious view that focuses on tariffs, brand reliance and execution risk might sit closer to the low end near $70. Seeing where your own Narrative sits on that spectrum can clarify your next move.
Do you think there's more to the story for PVH? Head over to our Community to see what others are saying!
This article by Simply Wall St is general in nature. We provide commentary based on historical data and analyst forecasts only using an unbiased methodology and our articles are not intended to be financial advice. It does not constitute a recommendation to buy or sell any stock, and does not take account of your objectives, or your financial situation. We aim to bring you long-term focused analysis driven by fundamental data. Note that our analysis may not factor in the latest price-sensitive company announcements or qualitative material. Simply Wall St has no position in any stocks mentioned.
Have feedback on this article? Concerned about the content? Get in touch with us directly. Alternatively, email editorial-team@simplywallst.com