
Does AT&T’s 5G and Fiber Push Justify Its Low Valuation in 2025?
- Wondering if AT&T is still a classic value play or a trap in disguise, especially with that hefty dividend and long history in investors' portfolios?
- The stock is up 7.4% year to date and 9.1% over the last year, but it has cooled a bit in the short term with a 3.2% drop over 7 days and a 1.3% slide over the past month, hinting that sentiment is still a bit cautious.
- Recent headlines have focused on AT&T's ongoing 5G and fiber rollout, its sizable debt load, and efforts to streamline the business after past media forays and divestitures. Together, these moves help explain why the market is slowly warming up to the stock again while still pricing in some execution risk.
- On our valuation checks, AT&T scores a perfect 6/6 for being undervalued. This is a strong signal, but not the whole story. Next we will walk through the main valuation approaches, then finish with a more intuitive way to understand what this price tag really implies.
Find out why AT&T's 9.1% return over the last year is lagging behind its peers.
Approach 1: AT&T Discounted Cash Flow (DCF) Analysis
A Discounted Cash Flow model projects a company’s future cash flows and then discounts them back into today’s dollars to estimate what the business is worth right now. For AT&T, the model uses a 2 Stage Free Cash Flow to Equity approach. It starts with last twelve month free cash flow of about $21.8 billion and then assumes moderate growth as the 5G and fiber investments mature.
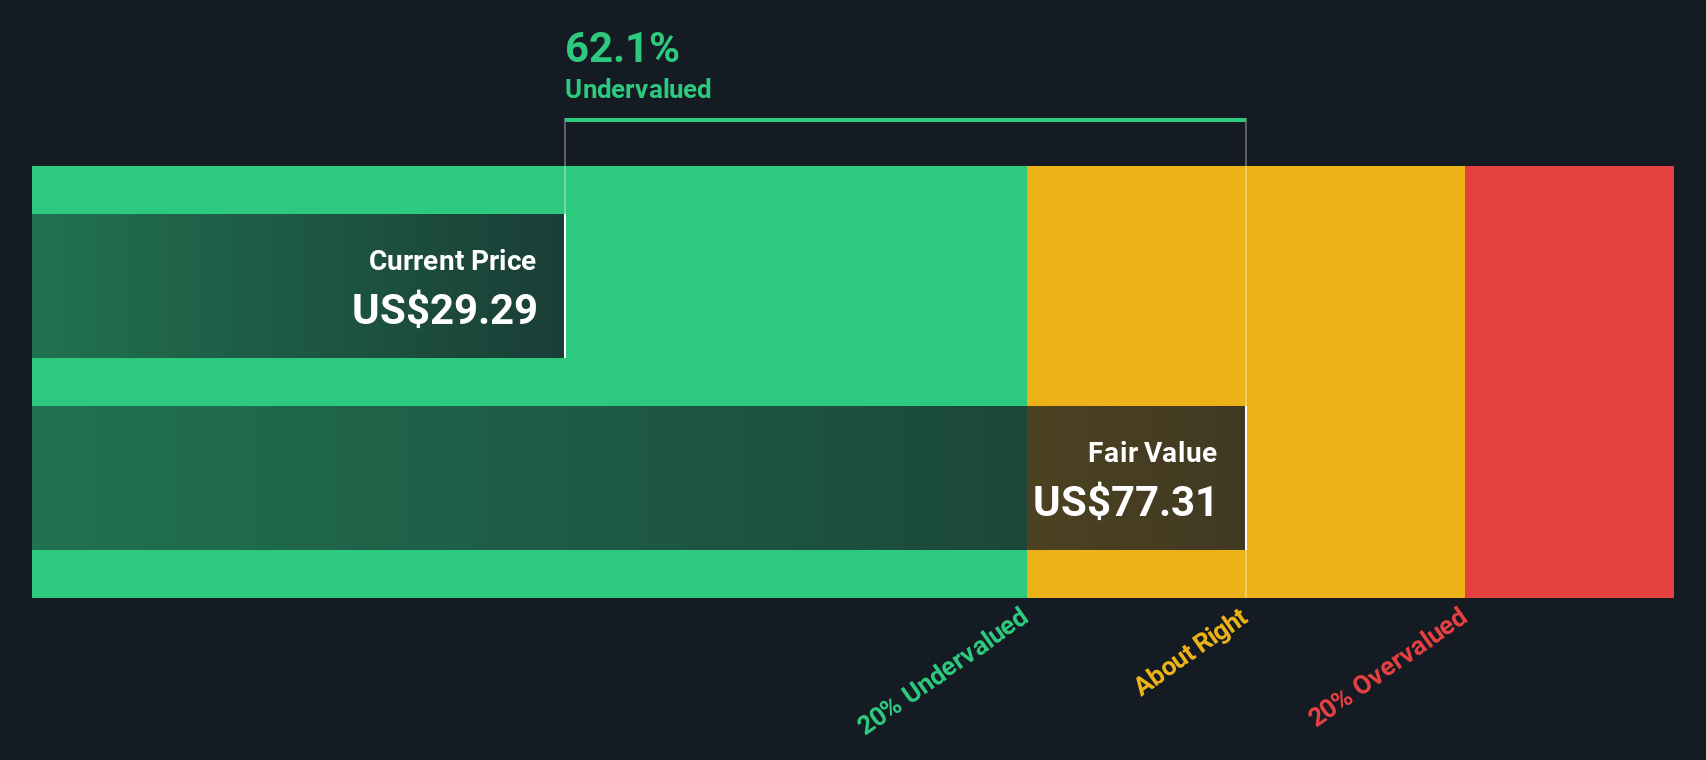
Analysts directly forecast free cash flow for the next several years, and Simply Wall St extrapolates these out further, with projections rising to roughly $24.8 billion by 2035. When all those future cash flows are discounted back to today using an appropriate required return, the model arrives at an intrinsic value of about $54.63 per share.
Compared with the current share price, this implies AT&T is trading at roughly a 55.1% discount to its estimated fair value. This suggests the market is still pricing in substantial execution and balance sheet risk.
Result: UNDERVALUED
Our Discounted Cash Flow (DCF) analysis suggests AT&T is undervalued by 55.1%. Track this in your watchlist or portfolio, or discover 895 more undervalued stocks based on cash flows.
Approach 2: AT&T Price vs Earnings
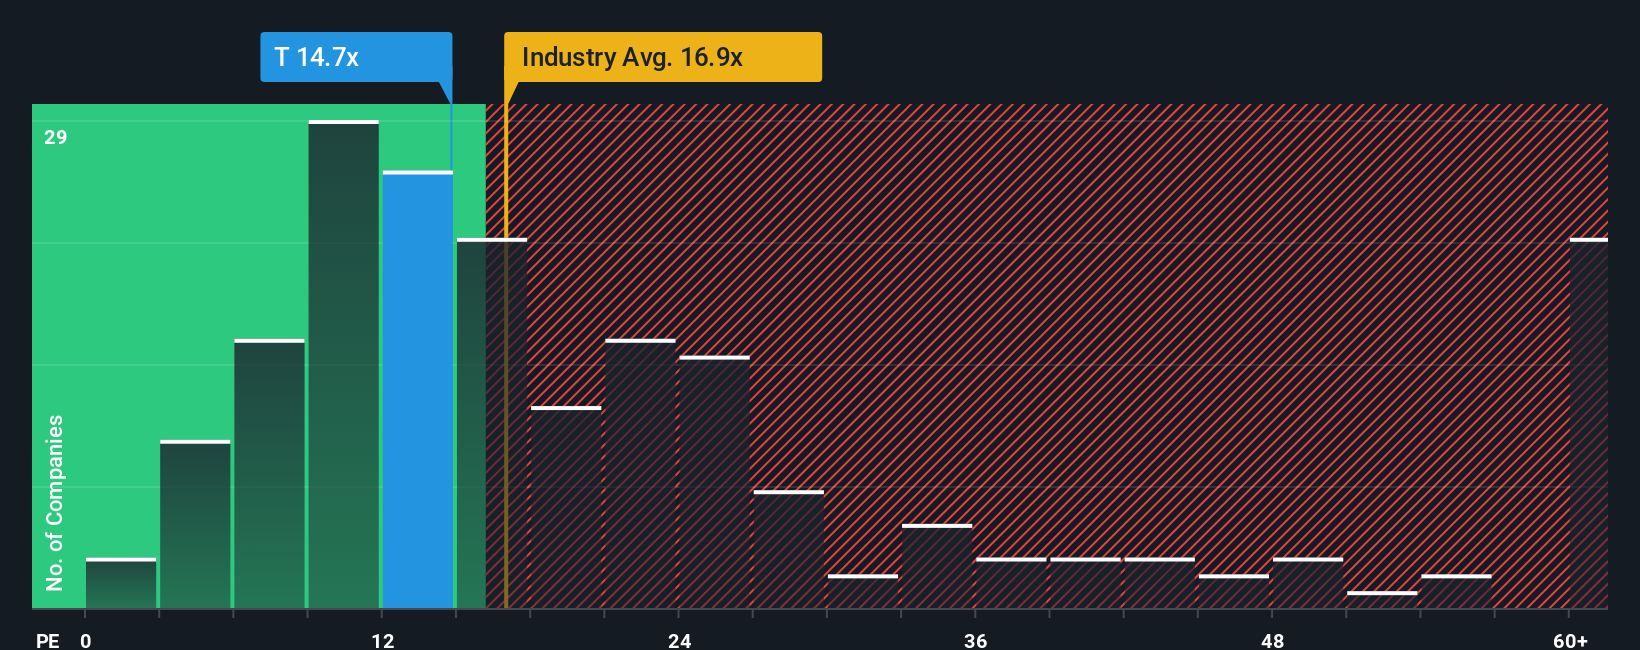
For profitable companies like AT&T, the price to earnings, or PE, ratio is a straightforward way to gauge how much investors are willing to pay for each dollar of current earnings. What counts as a reasonable PE depends on how fast those earnings are expected to grow and how risky the business is, with higher growth and lower risk typically justifying a higher multiple.
AT&T currently trades on a PE of about 7.8x, which is below both the Telecom industry average of roughly 16.2x and the peer group average of about 8.5x. Simply Wall St also calculates a Fair Ratio of around 11.4x, a proprietary estimate of what PE the stock should trade at given its earnings growth outlook, profit margins, industry, market value, and key risks.
This Fair Ratio is more tailored than a simple peer or industry comparison because it adjusts for AT&T’s specific fundamentals instead of assuming all telecom stocks deserve the same multiple. Comparing the current 7.8x PE to the 11.4x Fair Ratio suggests the market is still applying a sizeable discount to AT&T relative to what its risk and growth profile might warrant.
Result: UNDERVALUED
PE ratios tell one story, but what if the real opportunity lies elsewhere? Discover 1450 companies where insiders are betting big on explosive growth.
Upgrade Your Decision Making: Choose your AT&T Narrative
Earlier we mentioned that there is an even better way to understand valuation. Let us introduce you to Narratives, a simple way to connect your view of AT&T’s future to a concrete estimate of what the stock is worth.
A Narrative is your story behind the numbers, where you spell out what you believe about a company’s future revenue, earnings, margins, and risks, then link that story to a forecast and a Fair Value estimate.
On Simply Wall St, millions of investors use Narratives in the Community page to quickly see how a company’s story translates into financial outcomes, compare Fair Value to the current share price, and decide whether that setup looks like a buy, hold, or sell for them.
Because Narratives on the platform update dynamically when new information lands, such as earnings, news, or guidance changes, your AT&T view does not stay static but evolves as the facts change.
For example, one investor might build a bullish AT&T Narrative around stronger fiber driven growth and arrive at a Fair Value near 31.46 dollars. A more cautious investor, focused on competition and capital intensity, might land closer to 21.87 dollars instead.
Do you think there's more to the story for AT&T? Head over to our Community to see what others are saying!

This article by Simply Wall St is general in nature. We provide commentary based on historical data and analyst forecasts only using an unbiased methodology and our articles are not intended to be financial advice. It does not constitute a recommendation to buy or sell any stock, and does not take account of your objectives, or your financial situation. We aim to bring you long-term focused analysis driven by fundamental data. Note that our analysis may not factor in the latest price-sensitive company announcements or qualitative material. Simply Wall St has no position in any stocks mentioned.
Have feedback on this article? Concerned about the content? Get in touch with us directly. Alternatively, email editorial-team@simplywallst.com