
Is SLM Offering Long Term Value After Recent Share Price Weakness?
- Wondering if SLM is quietly trading below what it is really worth? You are not alone. This stock has been catching the eye of investors hunting for mispriced financial names.
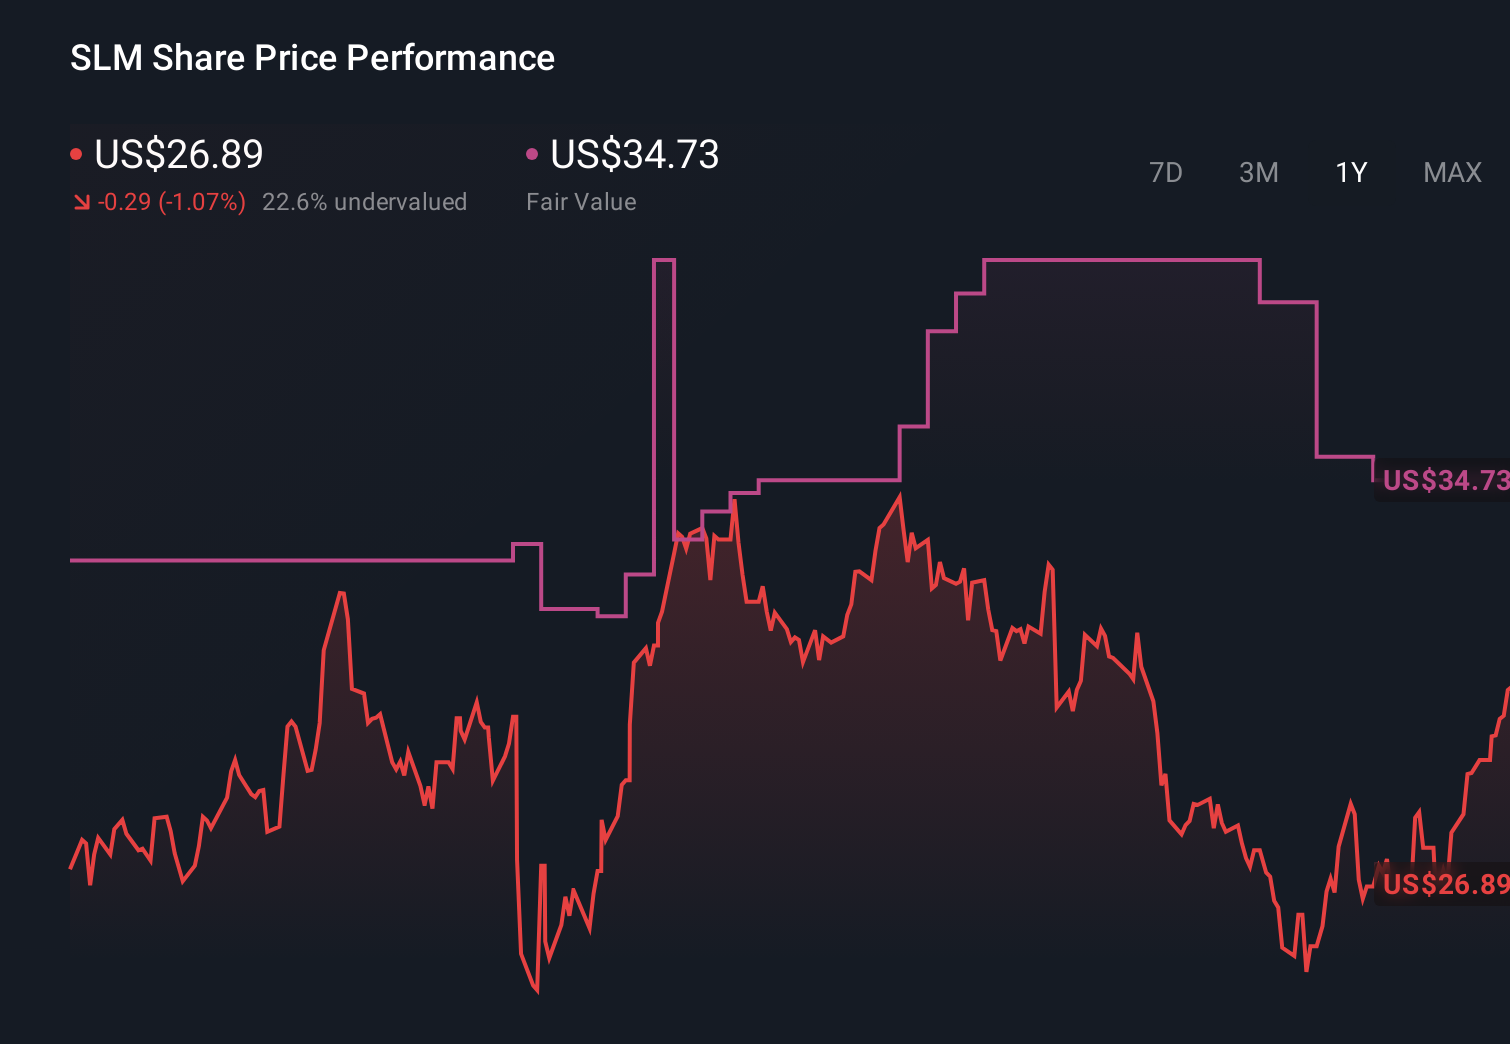
- Despite a choppy ride in the short term, with the share price down 12.8% over the last week and 4.1% year to date, the longer term story still shows gains of 68.1% over 3 years and 138.6% over 5 years.
- Recent market moves have come as investors reassess student loan and consumer credit exposure in a higher rate environment, putting diversified lenders like SLM back under the spotlight. Broader financial sector volatility and shifting expectations around regulation and credit quality have added an extra layer of uncertainty to how the market prices SLM today.
- Against that backdrop, SLM currently scores a full 6 out of 6 on our undervaluation checks, suggesting the market may be underestimating its fundamentals. Next, we will walk through the standard valuation approaches, before finishing with another way to understand what SLM could be worth.
Find out why SLM's 0.8% return over the last year is lagging behind its peers.
Approach 1: SLM Excess Returns Analysis
The Excess Returns model looks at how much profit a company can generate above the return that shareholders demand, then projects how long it can sustain that edge. For SLM, the key inputs show a strong value creation story.
SLM currently has a Book Value of $10.29 per share and a Stable EPS of $3.68 per share, based on weighted future Return on Equity estimates from 6 analysts. With an Average Return on Equity of 29.26%, the business is earning well above its Cost of Equity of $1.13 per share, which translates into an Excess Return of $2.55 per share.
Looking ahead, analysts expect the Stable Book Value to rise to $12.58 per share, based on estimates from 5 analysts. Using these inputs in the Excess Returns framework yields an intrinsic value of about $57.21 per share, meaning the stock is roughly 54.1% undervalued compared with the current market price.
This indicates that investors are heavily discounting a business that continues to earn returns comfortably above its cost of capital.
Result: UNDERVALUED
Our Excess Returns analysis suggests SLM is undervalued by 54.1%. Track this in your watchlist or portfolio, or discover 895 more undervalued stocks based on cash flows.
Approach 2: SLM Price vs Earnings
For a consistently profitable lender like SLM, the price to earnings ratio is a useful yardstick because it directly links what investors pay for the stock to the earnings the business generates today. In general, faster growth and lower risk justify a higher, or more expensive, PE multiple, while slower growth and higher uncertainty should translate into a lower one.
SLM currently trades on a PE of 8.78x. That is roughly in line with the broader Consumer Finance industry average of 8.84x, but well below the 46.05x average for its wider peer group, which likely includes higher growth or more speculative names. To cut through these broad comparisons, Simply Wall St uses a proprietary Fair Ratio, which estimates what SLM’s PE should be once factors such as earnings growth, profit margins, risk profile, industry dynamics and market cap are all taken into account.
On this basis, SLM’s Fair Ratio comes out at 14.36x, comfortably above its current 8.78x multiple. This suggests the market is still pricing SLM at a discount to what its fundamentals and risk profile would warrant.
Result: UNDERVALUED

PE ratios tell one story, but what if the real opportunity lies elsewhere? Discover 1450 companies where insiders are betting big on explosive growth.
Upgrade Your Decision Making: Choose your SLM Narrative
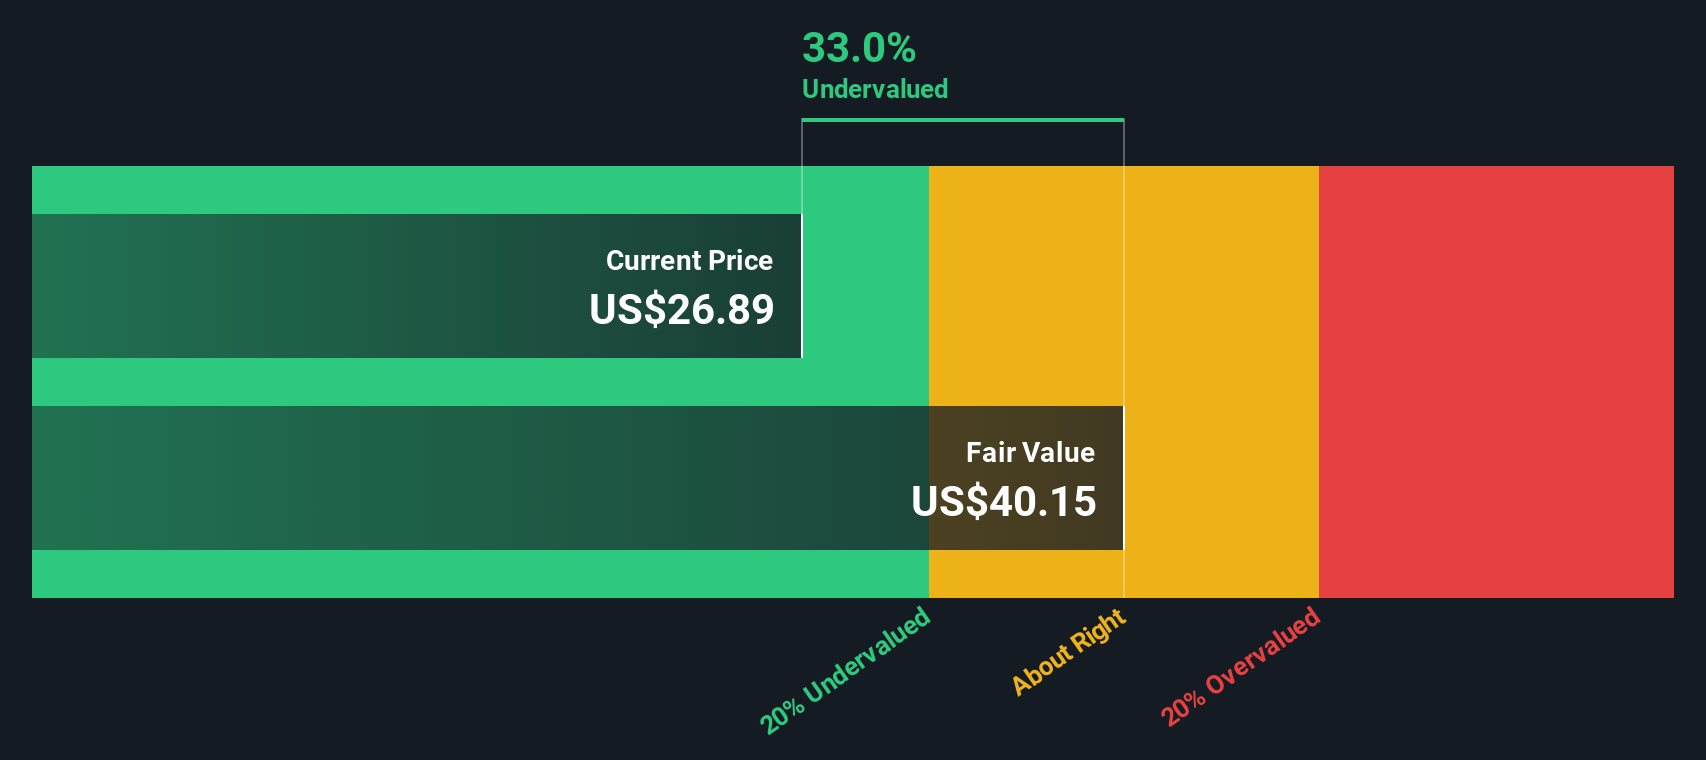
Earlier we mentioned that there is an even better way to understand valuation, so let us introduce you to Narratives, a simple way to connect your view of SLM’s future with a clear financial forecast and a fair value estimate. A Narrative is the story you believe about a company, expressed through your own assumptions for revenue growth, margins, earnings and what you think is a fair value, and on Simply Wall St’s Community page, millions of investors use Narratives to link that story to numbers and then compare Fair Value to today’s Price to inform whether they would buy, hold or sell. Because Narratives update dynamically as new information such as earnings or news hits the market, your view on SLM is never static. You can see how different perspectives stack up, from more cautious users who might see fair value closer to $29 per share to more optimistic investors who think SLM is worth nearer $40. This gives you a powerful, accessible framework to choose the SLM Narrative that best matches your conviction and risk tolerance.
Do you think there's more to the story for SLM? Head over to our Community to see what others are saying!
This article by Simply Wall St is general in nature. We provide commentary based on historical data and analyst forecasts only using an unbiased methodology and our articles are not intended to be financial advice. It does not constitute a recommendation to buy or sell any stock, and does not take account of your objectives, or your financial situation. We aim to bring you long-term focused analysis driven by fundamental data. Note that our analysis may not factor in the latest price-sensitive company announcements or qualitative material. Simply Wall St has no position in any stocks mentioned.
Have feedback on this article? Concerned about the content? Get in touch with us directly. Alternatively, email editorial-team@simplywallst.com