
Has Popular’s 143% Five Year Surge Already Priced In Its Future Returns?
- If you have been wondering whether Popular is still a buy after its big multi year run, you are not alone. This article will walk through what the current share price is really baking in.
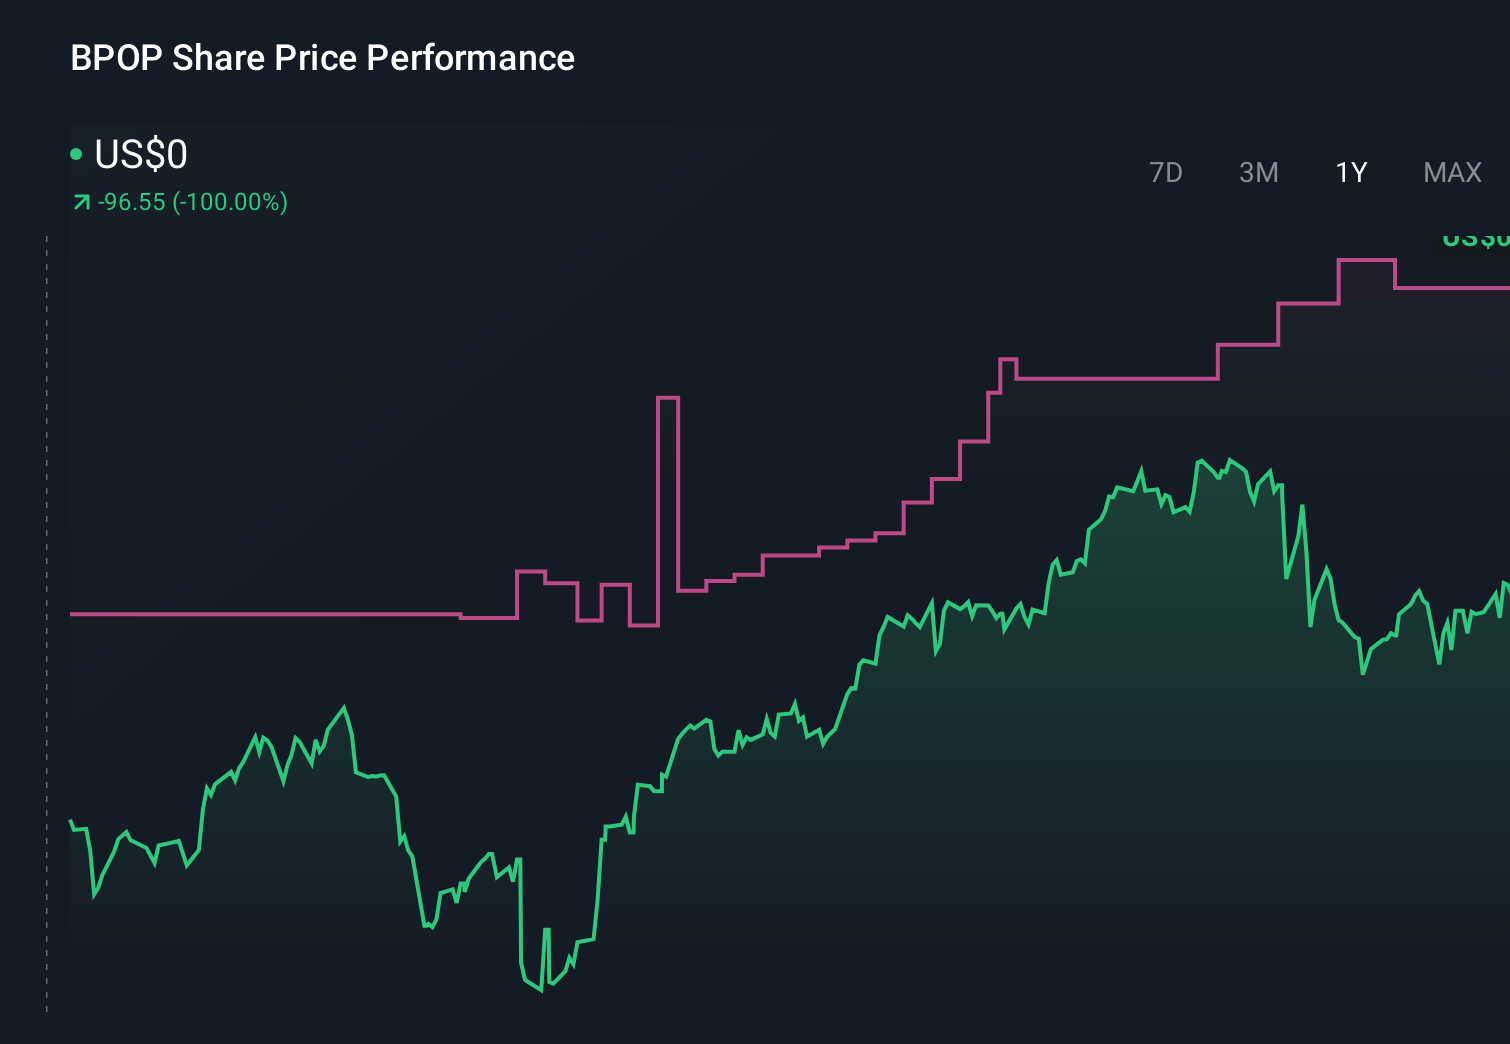
- The stock has slipped about 0.6% over the last week but remains up 1.0% over the past month, with a strong 25.7% gain year to date and a hefty 142.7% return over five years that suggests the market has steadily been repricing its prospects.
- Recent headlines have focused on Popular's positioning in Puerto Rico's banking market and its efforts to strengthen its balance sheet and capital return profile. This helps explain why investors have been willing to pay more for the stock over time. At the same time, sector wide conversations about interest rate paths and credit quality have added some volatility, making it even more important to separate sentiment from underlying value.
- Despite the strong run, Popular currently scores a 6/6 on our valuation checks. This suggests the shares still look undervalued across multiple lenses. In the sections ahead we will break down those methods while also exploring an even richer way to think about valuation beyond the usual models.
Approach 1: Popular Excess Returns Analysis
The Excess Returns model asks a simple question: does Popular earn more on shareholders' equity than it costs to provide that capital, and can it keep doing so as it grows? For Popular, the starting point is a book value of $91.00 per share, expected to rise to a stable book value of $105.08 per share, based on forecasts from five analysts.
Those same analysts see stable earnings of $13.06 per share, implying an average return on equity of 12.43%. Against a cost of equity of $7.31 per share, that leaves an excess return of $5.75 per share, the economic profit that the model capitalizes into an intrinsic value estimate.
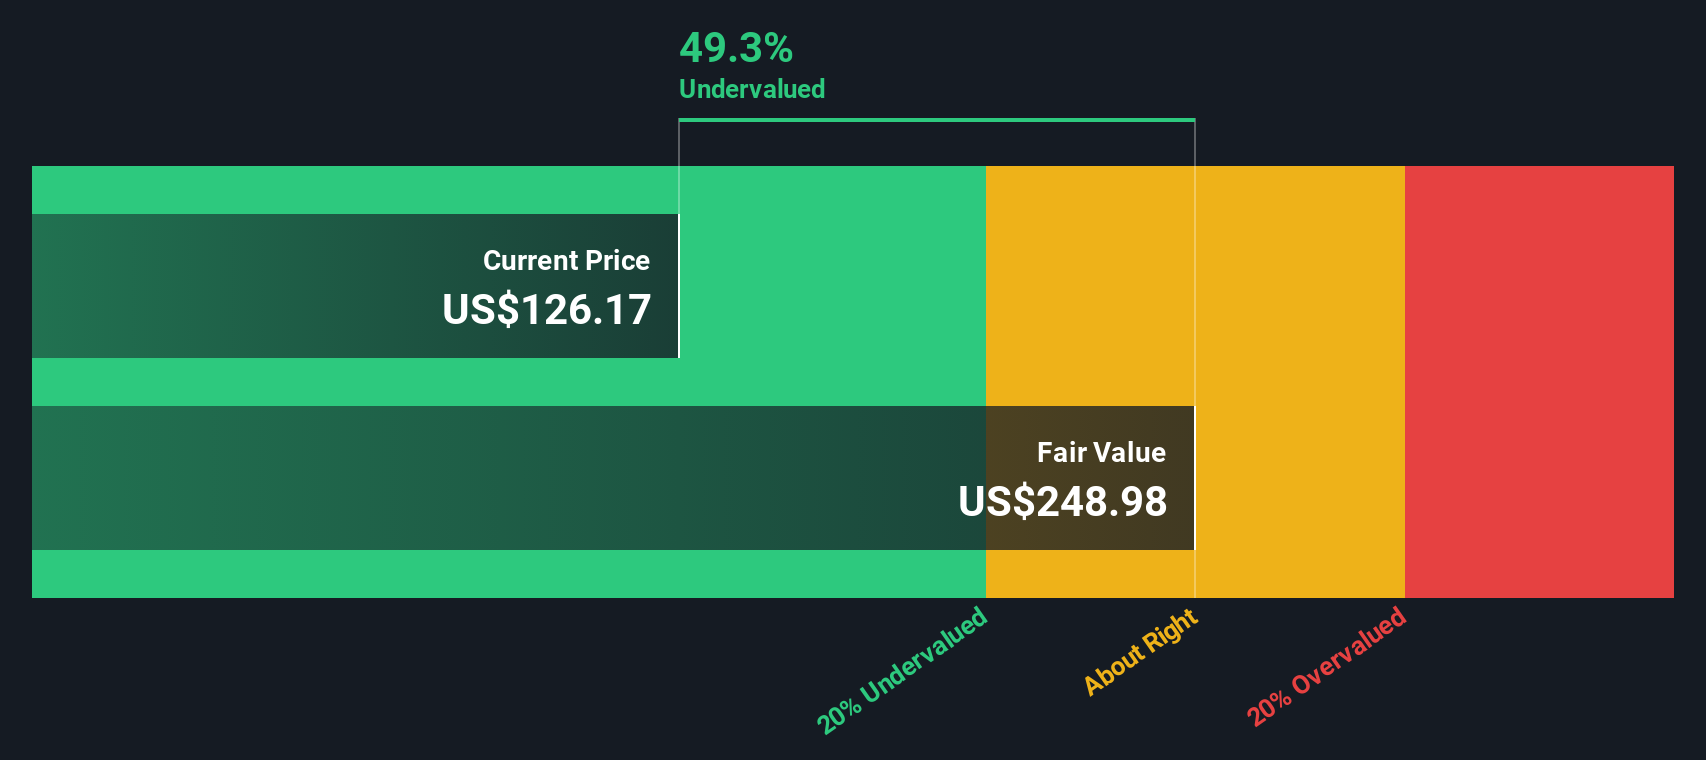
Using this Excess Returns framework, Simply Wall St arrives at a fair value of about $260.66 per share. Compared with the current market price, this implies the stock is roughly 55.3% undervalued. This suggests investors are not fully pricing in Popular's ability to generate returns above its cost of capital.
Result: UNDERVALUED
Our Excess Returns analysis suggests Popular is undervalued by 55.3%. Track this in your watchlist or portfolio, or discover 895 more undervalued stocks based on cash flows.
Approach 2: Popular Price vs Earnings
For a consistently profitable bank like Popular, the price to earnings, PE, ratio is a useful shorthand for how much investors are willing to pay for each dollar of current earnings. It naturally reflects expectations for future growth and the risk investors see in those earnings.
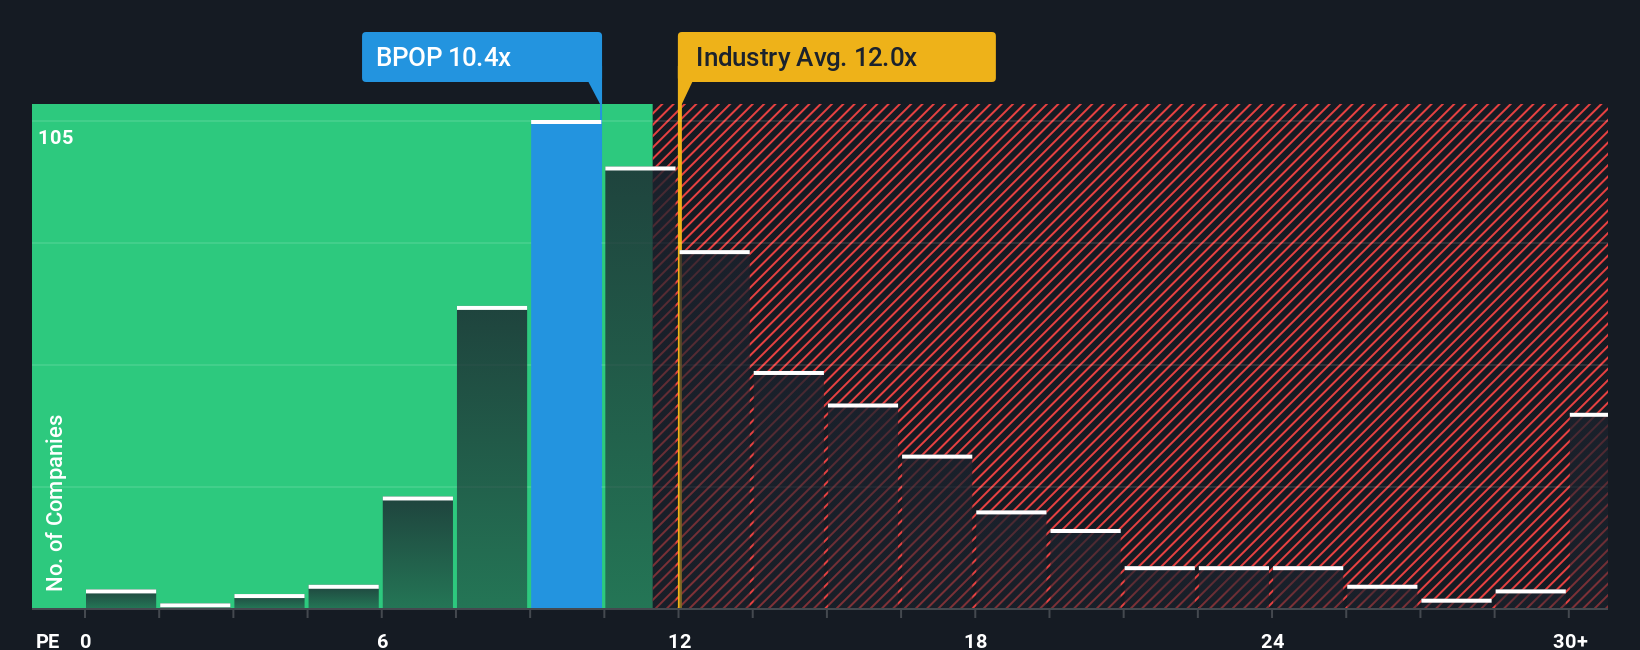
In general, faster growing and lower risk companies can justify a higher PE, while slower growth or riskier earnings usually warrant a lower multiple. Popular currently trades on a PE of about 10.02x, below the US Banks industry average of roughly 11.65x and the peer group average of around 12.05x. This suggests the market is applying a discount relative to comparable names.
Simply Wall St also calculates a Fair Ratio of 12.54x, a proprietary estimate of the PE Popular might deserve based on its earnings growth outlook, risk profile, profit margins, industry positioning and market capitalization. This is more informative than a simple peer or industry comparison because it is tailored to Popular’s specific fundamentals rather than broad averages. With the Fair Ratio sitting noticeably above the current 10.02x, the multiple analysis indicates that the shares are trading below what those fundamentals might justify.
Result: UNDERVALUED
PE ratios tell one story, but what if the real opportunity lies elsewhere? Discover 1450 companies where insiders are betting big on explosive growth.
Upgrade Your Decision Making: Choose your Popular Narrative
Earlier we mentioned that there is an even better way to understand valuation, so let us introduce you to Narratives, a simple way to connect your view of Popular’s future to a set of numbers and a clear fair value. A Narrative on Simply Wall St lets you spell out the story you believe in, such as how fast revenue grows, how margins evolve, and what multiple the market might pay, and then automatically links that story to a full forecast and an intrinsic value estimate. Narratives are available on the Community page of the Simply Wall St platform, used by millions of investors, and make it easy to compare your Fair Value to the current share price so you can decide whether Popular looks like a buy, a hold, or a sell. They also update dynamically as new earnings, news, or guidance arrive, so your thesis stays live rather than static. For example, one investor might build a more optimistic Popular Narrative that supports a fair value near $155.00 per share, while another, more cautious investor might see only about $123.00, and both perspectives are made explicit and comparable through the Narrative framework.
Do you think there's more to the story for Popular? Head over to our Community to see what others are saying!
This article by Simply Wall St is general in nature. We provide commentary based on historical data and analyst forecasts only using an unbiased methodology and our articles are not intended to be financial advice. It does not constitute a recommendation to buy or sell any stock, and does not take account of your objectives, or your financial situation. We aim to bring you long-term focused analysis driven by fundamental data. Note that our analysis may not factor in the latest price-sensitive company announcements or qualitative material. Simply Wall St has no position in any stocks mentioned.
Have feedback on this article? Concerned about the content? Get in touch with us directly. Alternatively, email editorial-team@simplywallst.com