
Is Concentrix Now an Opportunity After a 67.8% Three Year Share Price Slide?
- If you have been wondering whether Concentrix is a beaten down bargain or a value trap, you are not alone. This article will walk through the numbers in plain English.
- The stock has bounced recently, up 3.2% over the last week and 10.4% over the past month, even though it is still down 12.5% year to date and 11.3% over the last year. Over a longer horizon, it has seen a much steeper 67.8% slide over three years and 59.0% over five.
- That kind of whiplash performance has been shaped by shifting sentiment around customer experience outsourcing and tech enabled services, with investors rethinking how durable Concentrix's client relationships and margins really are. At the same time, strategic moves in digital transformation and AI capabilities have drawn fresh attention to whether the market has become too pessimistic about its long term cash generation.
- On our framework Concentrix currently scores a 6/6 valuation check, suggesting the shares screen as undervalued across every metric we use. Next we will unpack exactly how those methods work, before finishing with a more holistic way of thinking about what its valuation really implies for long term investors.
Find out why Concentrix's -11.3% return over the last year is lagging behind its peers.
Approach 1: Concentrix Discounted Cash Flow (DCF) Analysis
A Discounted Cash Flow, or DCF, model estimates what a business is worth by projecting the cash it can generate in the future and then discounting those cash flows back to today.
For Concentrix, the latest twelve month Free Cash Flow is about $507.0 Million. Analysts expect this to grow steadily, with Simply Wall St extending their forecasts beyond the first few years. On this basis, annual Free Cash Flow is projected to reach roughly $1.0 Billion by 2030. This is shown in the step up from the mid $800 Million range around 2026 to over $1.2 Billion by 2035.
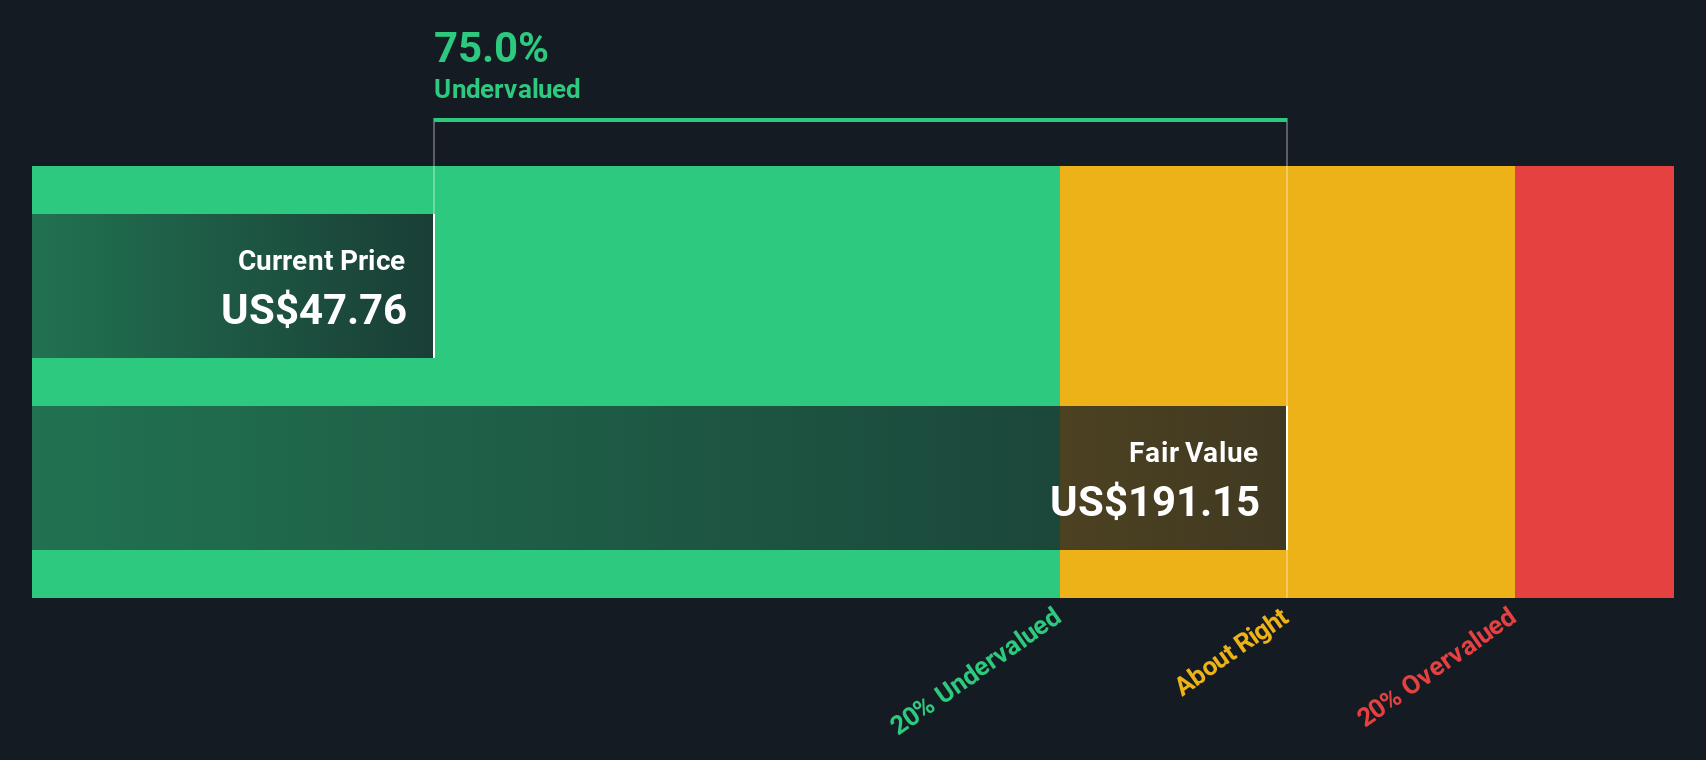
Adding up all those discounted cash flows using a 2 Stage Free Cash Flow to Equity model gives an estimated intrinsic value of about $173 per share. Compared with the current market price, this implies the stock is trading at roughly a 78.0% discount. This suggests investors are pricing in far weaker cash generation than the model assumes.
Result: UNDERVALUED
Our Discounted Cash Flow (DCF) analysis suggests Concentrix is undervalued by 78.0%. Track this in your watchlist or portfolio, or discover 895 more undervalued stocks based on cash flows.
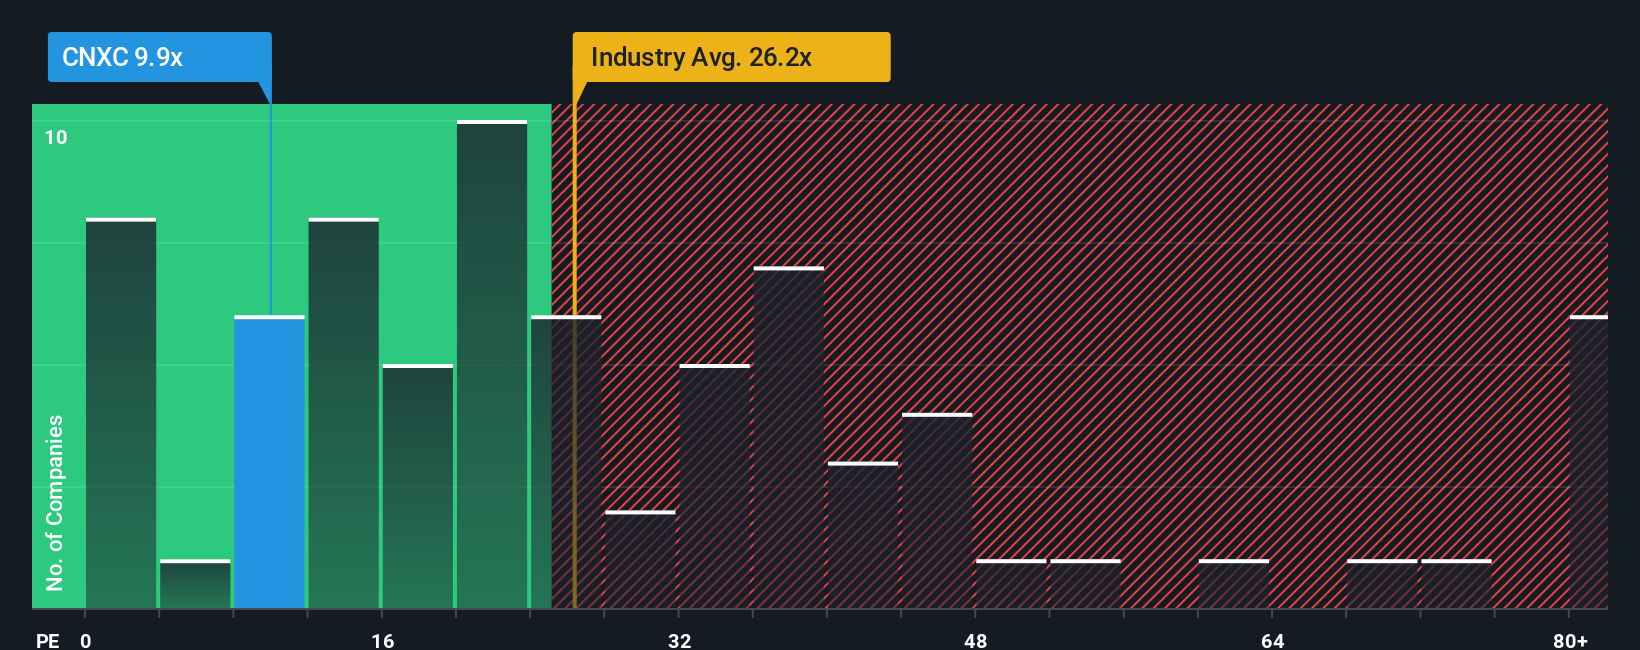
Approach 2: Concentrix Price vs Earnings
For profitable companies like Concentrix, the Price to Earnings, or PE, ratio is often a clear way to gauge valuation because it compares what investors pay today with the earnings the business is already generating. In general, faster growth and lower perceived risk justify a higher PE, while slower or uncertain growth should trade on a lower multiple.
Concentrix currently trades on a PE of about 7.9x, which is below both the Professional Services industry average of roughly 24.9x and the wider peer group average of around 29.7x. Simply Wall St also calculates a Fair Ratio of 20.6x, its proprietary estimate of the PE that could be reasonable given Concentrix's earnings growth profile, margins, industry, market cap and specific risks.
This Fair Ratio can be more informative than a simple peer or industry comparison because it attempts to adjust for how quickly Concentrix is growing, how profitable it is and how risky its earnings may be, rather than assuming all companies deserve the same multiple. With the shares trading on 7.9x compared with a Fair Ratio of 20.6x, the PE lens suggests that Concentrix may be trading at a lower valuation than this measure implies.
Result: UNDERVALUED
PE ratios tell one story, but what if the real opportunity lies elsewhere? Discover 1450 companies where insiders are betting big on explosive growth.
Upgrade Your Decision Making: Choose your Concentrix Narrative
Earlier we mentioned that there is an even better way to understand valuation, so let us introduce you to Narratives, a simple tool on Simply Wall St’s Community page that helps you connect your personal view of Concentrix’s story with a concrete forecast and Fair Value. You can then compare that Fair Value with today’s share price to consider whether the stock looks attractive or unattractive at its current level.
A Narrative is your own investing storyline, where you spell out how you think Concentrix’s revenue, earnings and margins will evolve. You link those assumptions to catalysts or risks like AI integration, Webhelp synergies, client concentration or debt, and then translate that into a fair value estimate that updates dynamically when new earnings, guidance or news hits the market.
For example, one investor might build a bullish Narrative that leans on accelerating AI monetisation, rising margins and a Fair Value near the current high analyst target of about $80 per share. Another could take a more cautious view that emphasises slow top line growth, integration challenges and compressed multiples, landing closer to the low target near $61. Narratives make these differing perspectives and their implications easy to compare at a glance.
Do you think there's more to the story for Concentrix? Head over to our Community to see what others are saying!

This article by Simply Wall St is general in nature. We provide commentary based on historical data and analyst forecasts only using an unbiased methodology and our articles are not intended to be financial advice. It does not constitute a recommendation to buy or sell any stock, and does not take account of your objectives, or your financial situation. We aim to bring you long-term focused analysis driven by fundamental data. Note that our analysis may not factor in the latest price-sensitive company announcements or qualitative material. Simply Wall St has no position in any stocks mentioned.
Have feedback on this article? Concerned about the content? Get in touch with us directly. Alternatively, email editorial-team@simplywallst.com