
Is PepsiCo a Value Opportunity After Recent Shift Toward Snacks and Zero Sugar Drinks
- If you have ever wondered whether PepsiCo is quietly turning into a value opportunity or just a steady dividend name at a fair price, you are exactly who this breakdown is for.
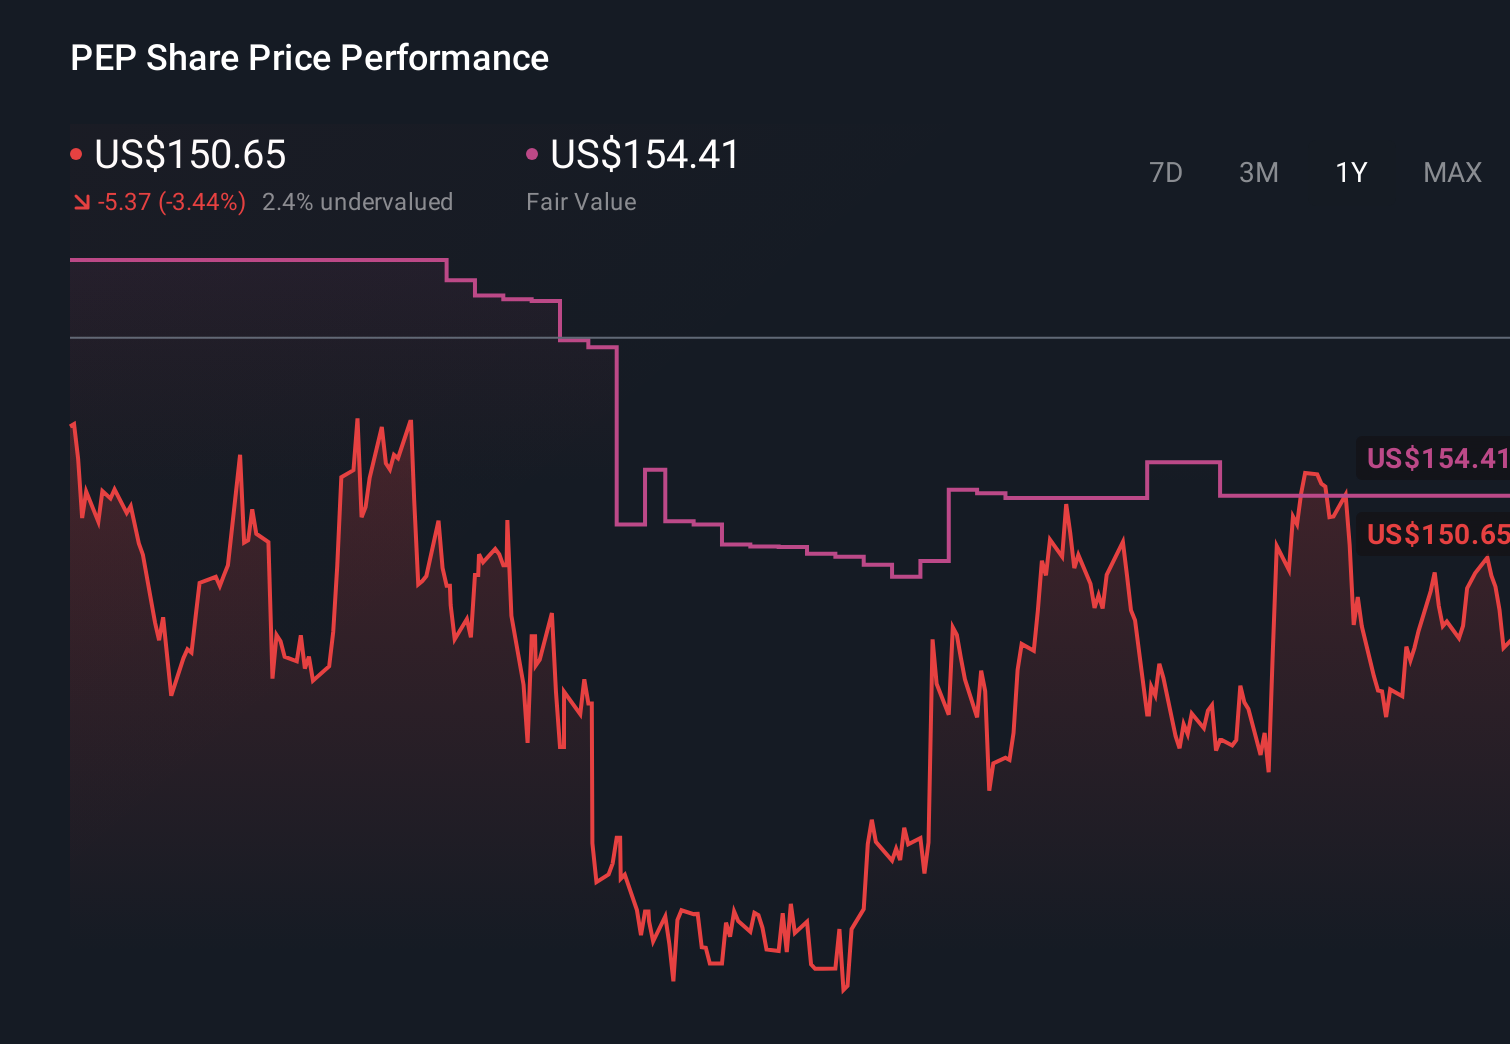
- PepsiCo's share price has drifted lately, slipping 2.3% over the last week and down 4.1% over the past year, even though it is still up 16.5% over five years. This mix hints at shifting market expectations rather than a broken story.
- Recent headlines have focused on PepsiCo's continued push into higher margin snacks and zero sugar beverages, alongside ongoing investments in automation and supply chain efficiency. At the same time, investors are weighing how these strategic shifts position the company against global consumer trends and intensifying competition in both drinks and snacks.
- Right now, PepsiCo scores just 2/6 on our valuation checks, suggesting the stock only screens as undervalued on a couple of lenses. This makes how we value it even more important. Next we will walk through the main valuation approaches investors use for PepsiCo, then finish with a more complete way of thinking about what the stock is really worth.
PepsiCo scores just 2/6 on our valuation checks. See what other red flags we found in the full valuation breakdown.
Approach 1: PepsiCo Discounted Cash Flow (DCF) Analysis
A Discounted Cash Flow, or DCF, model estimates what a business is worth by projecting the cash it can generate in the future and discounting those cash flows back to today.
For PepsiCo, the model starts with last twelve month Free Cash Flow of about $6.4 billion and uses analyst forecasts for the next few years. It then extends those cash flows further into the future using Simply Wall St extrapolations. By 2029, PepsiCo's Free Cash Flow is projected to reach roughly $13.7 billion, with growth gradually slowing as the company matures.
All of those future cash flows are discounted back using a required rate of return to arrive at an estimated intrinsic value of $246.92 per share. Compared with the current share price, this comparison suggests the stock is trading at about a 41.4% discount to its modeled fair value, based on these cash flow assumptions.
Result: UNDERVALUED
Our Discounted Cash Flow (DCF) analysis suggests PepsiCo is undervalued by 41.4%. Track this in your watchlist or portfolio, or discover 895 more undervalued stocks based on cash flows.
Approach 2: PepsiCo Price vs Earnings
For a mature, consistently profitable business like PepsiCo, the Price to Earnings (PE) ratio is a useful way to see what investors are willing to pay for each dollar of current earnings. It folds in expectations about future growth and perceived risk, since companies with faster, more reliable earnings growth usually justify a higher PE, while slower or riskier names tend to trade on lower multiples.
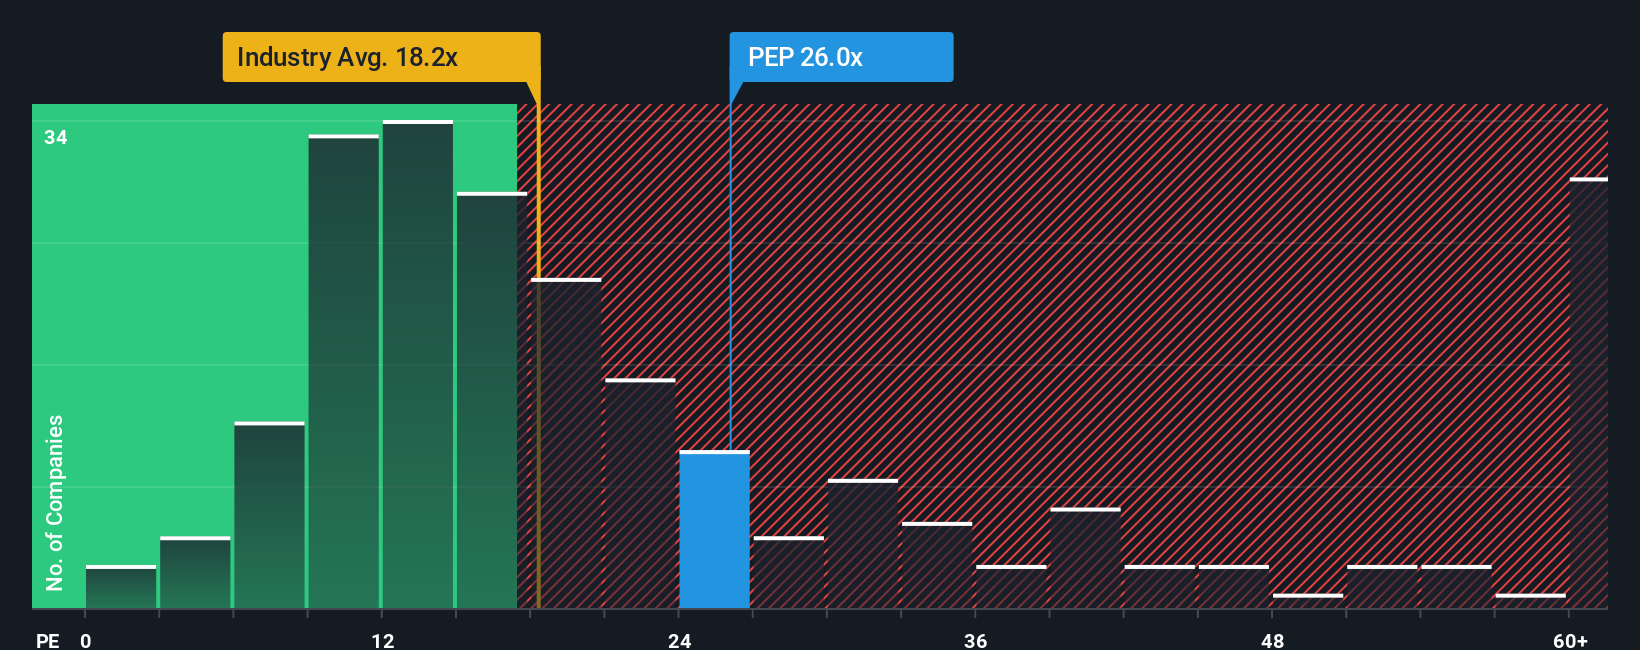
PepsiCo currently trades on a PE of about 27.7x, which is higher than the broader Beverage industry average of around 17.4x and also a touch above the peer group average of 26.1x. On the surface, that suggests investors already pay a premium for PepsiCo's earnings relative to many competitors.
To refine this view, Simply Wall St calculates a Fair Ratio of 26.8x, which is the PE we would expect once we factor in PepsiCo's specific earnings growth outlook, risk profile, profit margins, industry positioning and market cap. This is more tailored than a simple peer or industry comparison because it adjusts for what actually drives value. Against that Fair Ratio of 26.8x, the current 27.7x PE points to PepsiCo trading at a modest premium.
Result: OVERVALUED
PE ratios tell one story, but what if the real opportunity lies elsewhere? Discover 1450 companies where insiders are betting big on explosive growth.
Upgrade Your Decision Making: Choose your PepsiCo Narrative
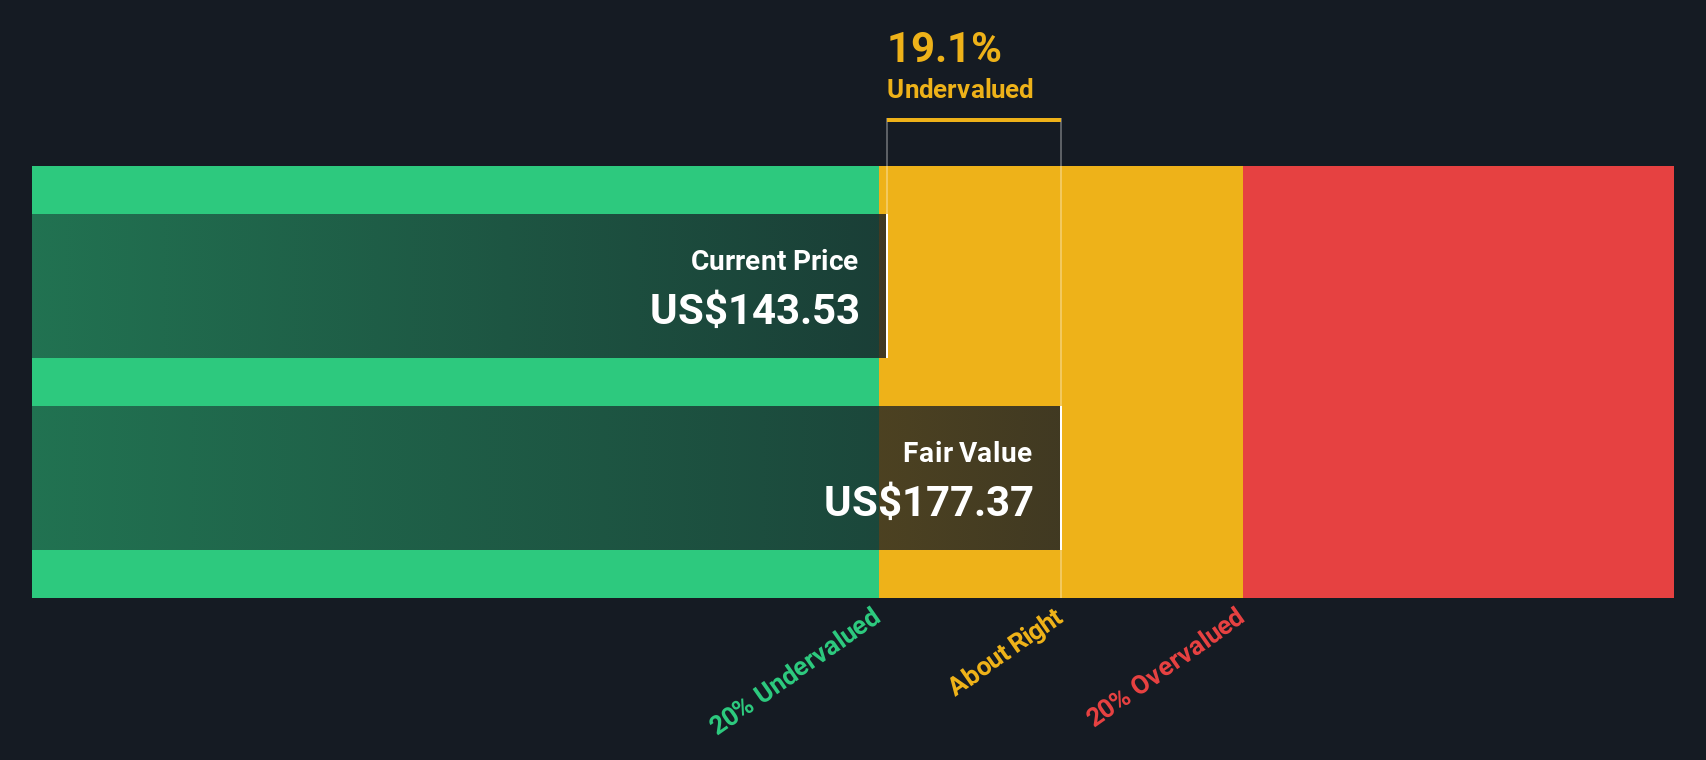
Earlier we mentioned that there is an even better way to understand valuation, so let us introduce you to Narratives, a simple way to connect your view of PepsiCo’s story with concrete forecasts for its future revenue, earnings and margins, then translate that into a Fair Value you can compare against today’s price. A Narrative on Simply Wall St’s Community page lets you spell out why you think PepsiCo will win or struggle, link that story to numbers, and instantly see whether your Fair Value suggests it is a buy, hold or sell at the current market price. Narratives are dynamic, automatically updating as new earnings, news or guidance arrive, so your investment case evolves rather than going stale. For example, one PepsiCo Narrative might assume robust international expansion, margin gains from automation and a Fair Value closer to the bullish 175 dollar target. A more cautious Narrative could focus on slower health product adoption, input cost pressure and a Fair Value nearer the bearish 115 dollar view, giving you a clear, numbers backed way to choose which story you believe and how to interpret it.
Do you think there's more to the story for PepsiCo? Head over to our Community to see what others are saying!
This article by Simply Wall St is general in nature. We provide commentary based on historical data and analyst forecasts only using an unbiased methodology and our articles are not intended to be financial advice. It does not constitute a recommendation to buy or sell any stock, and does not take account of your objectives, or your financial situation. We aim to bring you long-term focused analysis driven by fundamental data. Note that our analysis may not factor in the latest price-sensitive company announcements or qualitative material. Simply Wall St has no position in any stocks mentioned.
Have feedback on this article? Concerned about the content? Get in touch with us directly. Alternatively, email editorial-team@simplywallst.com