
Is Alphatec Holdings Still Attractive After Its 128% 2025 Surge?
- If you are wondering whether Alphatec Holdings at around $20.67 is still a smart buy after its huge run, or if the easy money has already been made, you are not alone.
- The stock has slipped 2.6% over the last week but is still up 2.1% over 30 days, with an eye catching 128.1% gain year to date and 113.3% over the past year. This naturally raises questions about how much upside is left.
- Investors have been reacting to a stream of positive updates around Alphatec's expanding spine surgery platform and the growing adoption of its technologies. These developments have helped reframe the company as a higher growth player in the medtech space. At the same time, the broader healthcare sector's renewed interest in innovative surgical solutions has supported the narrative behind the stock's rally.
- On our framework, Alphatec scores a 2/6 valuation score, reflecting that it screens as undervalued on only a couple of checks. We will unpack what that means using multiple valuation approaches, then circle back at the end with a more holistic way to judge whether the market is really pricing its story correctly.
Alphatec Holdings scores just 2/6 on our valuation checks. See what other red flags we found in the full valuation breakdown.
Approach 1: Alphatec Holdings Discounted Cash Flow (DCF) Analysis
A Discounted Cash Flow model estimates what a company is worth today by projecting the cash it could generate in the future and then discounting those cash flows back to a present value using a required rate of return.
For Alphatec Holdings, the model used is a 2 Stage Free Cash Flow to Equity approach, based on cash flows reported and projected in $. The latest twelve month free cash flow is currently negative at about $60.4 Million, reflecting ongoing investment and scaling. From there, analyst forecasts and Simply Wall St extrapolations point to a sharp improvement, with free cash flow expected to reach roughly $621.5 Million by 2035 as the business matures and margins expand.
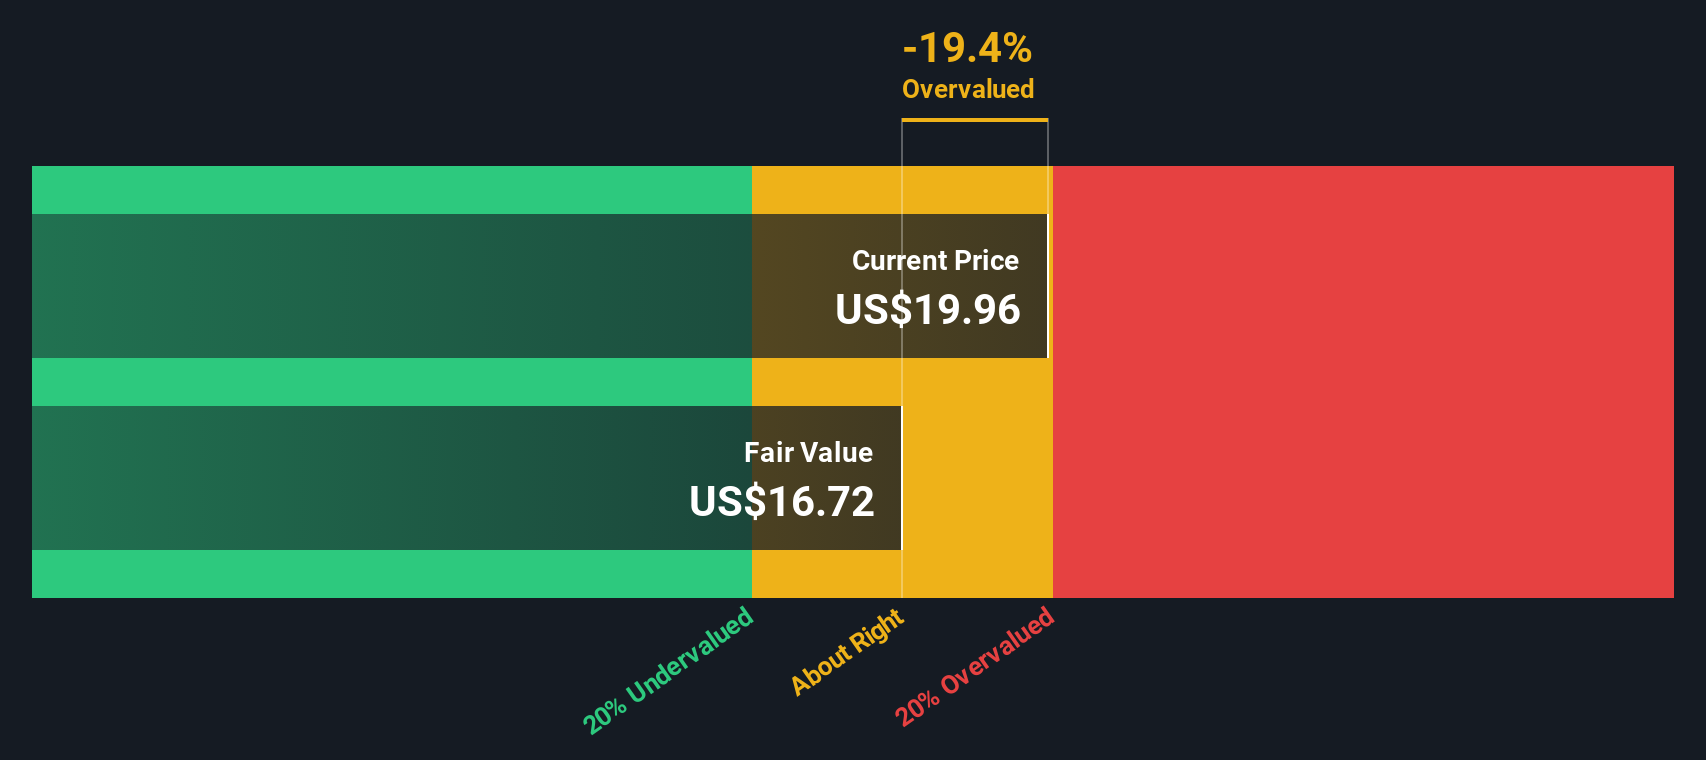
When all those projected cash flows are discounted back and added up, the DCF model suggests an intrinsic value of about $55.14 per share. Compared with the recent share price around $20.67, the stock screens as roughly 62.5% undervalued on this basis. This indicates that the market may not be fully pricing in Alphatec's expected cash generation.
Result: UNDERVALUED
Our Discounted Cash Flow (DCF) analysis suggests Alphatec Holdings is undervalued by 62.5%. Track this in your watchlist or portfolio, or discover 895 more undervalued stocks based on cash flows.
Approach 2: Alphatec Holdings Price vs Sales
For companies that are still moving toward consistent profitability, the price to sales ratio is a useful way to compare how much investors are paying for each dollar of revenue, without getting distorted by near term losses or heavy investment spending.
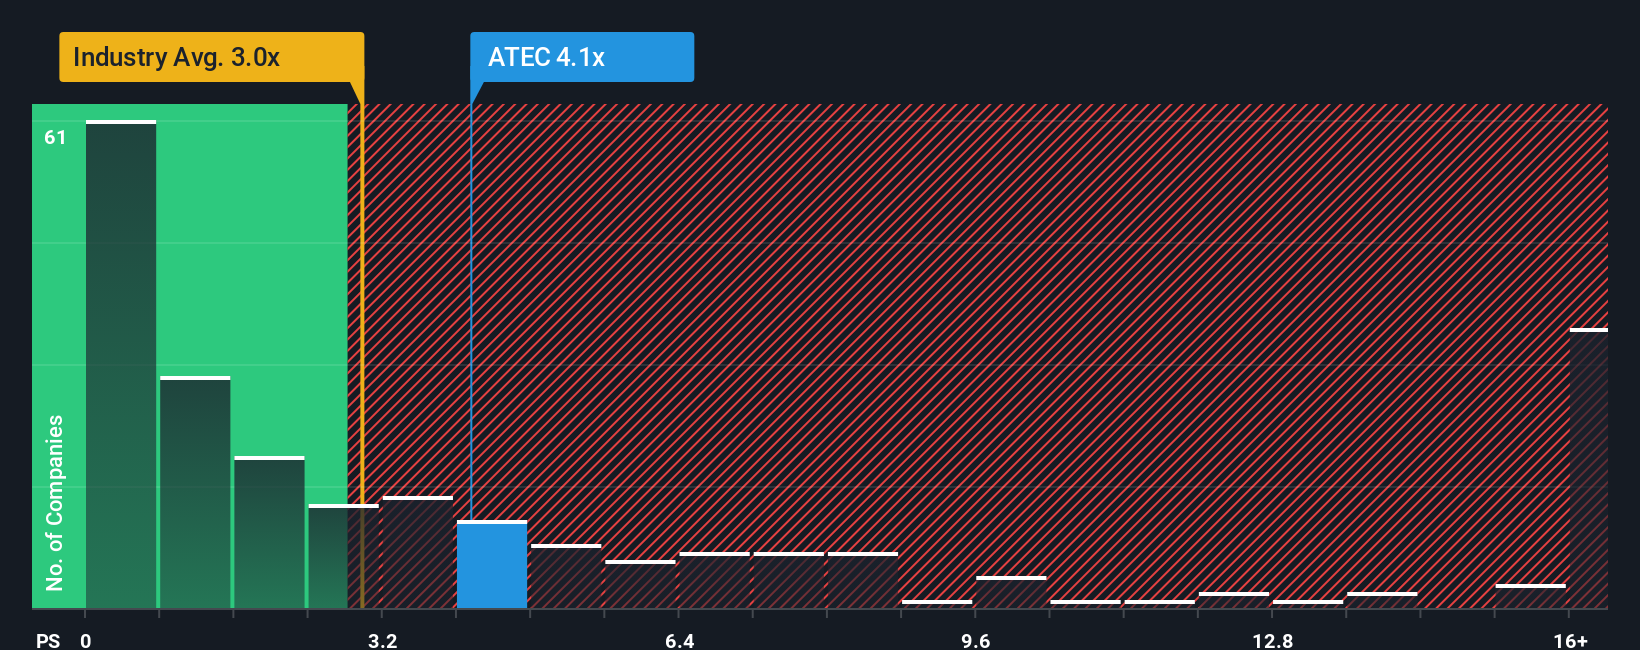
In general, faster revenue growth and lower perceived risk justify a higher price to sales multiple, while slower growth or higher uncertainty call for a lower one. Alphatec currently trades on a price to sales ratio of about 4.22x, compared with the broader Medical Equipment industry average of roughly 3.45x and a peer group average near 2.45x, so it does screen as richer than many comparables on a simple sales basis.
Simply Wall St’s Fair Ratio framework refines this by estimating what Alphatec’s price to sales multiple should be, given its growth prospects, profitability profile, risk factors, industry positioning and market cap. That Fair Ratio comes out at around 4.01x, only slightly below the current 4.22x. This suggests that once you properly account for Alphatec’s growth runway and risk profile, the stock is trading close to what the model considers a reasonable valuation on sales.
Result: ABOUT RIGHT
PS ratios tell one story, but what if the real opportunity lies elsewhere? Discover 1450 companies where insiders are betting big on explosive growth.
Upgrade Your Decision Making, Choose your Alphatec Holdings Narrative
Earlier we mentioned that there is an even better way to understand valuation, so let us introduce you to Narratives, a simple framework where you describe the story you believe about Alphatec Holdings and connect it to specific forecasts for future revenue, earnings, margins and ultimately a fair value estimate. On Simply Wall St’s Community page, millions of investors use Narratives to link a company’s qualitative story to a quantitative model, so you can see how an outlook about surgeon adoption, robotics launches or competitive pressure actually translates into numbers and a price you are willing to pay. Each Narrative then compares its Fair Value against the current share price to highlight whether, under that story, Alphatec appears to be a buy, hold or sell, and it automatically updates when new news, earnings or guidance changes arrive. For example, one Alphatec Narrative might assume revenue increases to around $1.1 billion with improving margins and justify a fair value near $23.75 per share, while a more cautious Narrative might focus on regulatory and competitive risks and point to a fair value closer to $14, showing how different perspectives lead to very different decisions.
Do you think there's more to the story for Alphatec Holdings? Head over to our Community to see what others are saying!

This article by Simply Wall St is general in nature. We provide commentary based on historical data and analyst forecasts only using an unbiased methodology and our articles are not intended to be financial advice. It does not constitute a recommendation to buy or sell any stock, and does not take account of your objectives, or your financial situation. We aim to bring you long-term focused analysis driven by fundamental data. Note that our analysis may not factor in the latest price-sensitive company announcements or qualitative material. Simply Wall St has no position in any stocks mentioned.
Have feedback on this article? Concerned about the content? Get in touch with us directly. Alternatively, email editorial-team@simplywallst.com