
Does Teck Resources Share Price Reflect Its DCF Upside After Strategic Portfolio Moves?
- If you are wondering whether Teck Resources at about CA$61.95 is a bargain or already priced for perfection, you are not alone. That question is exactly what we are going to unpack here.
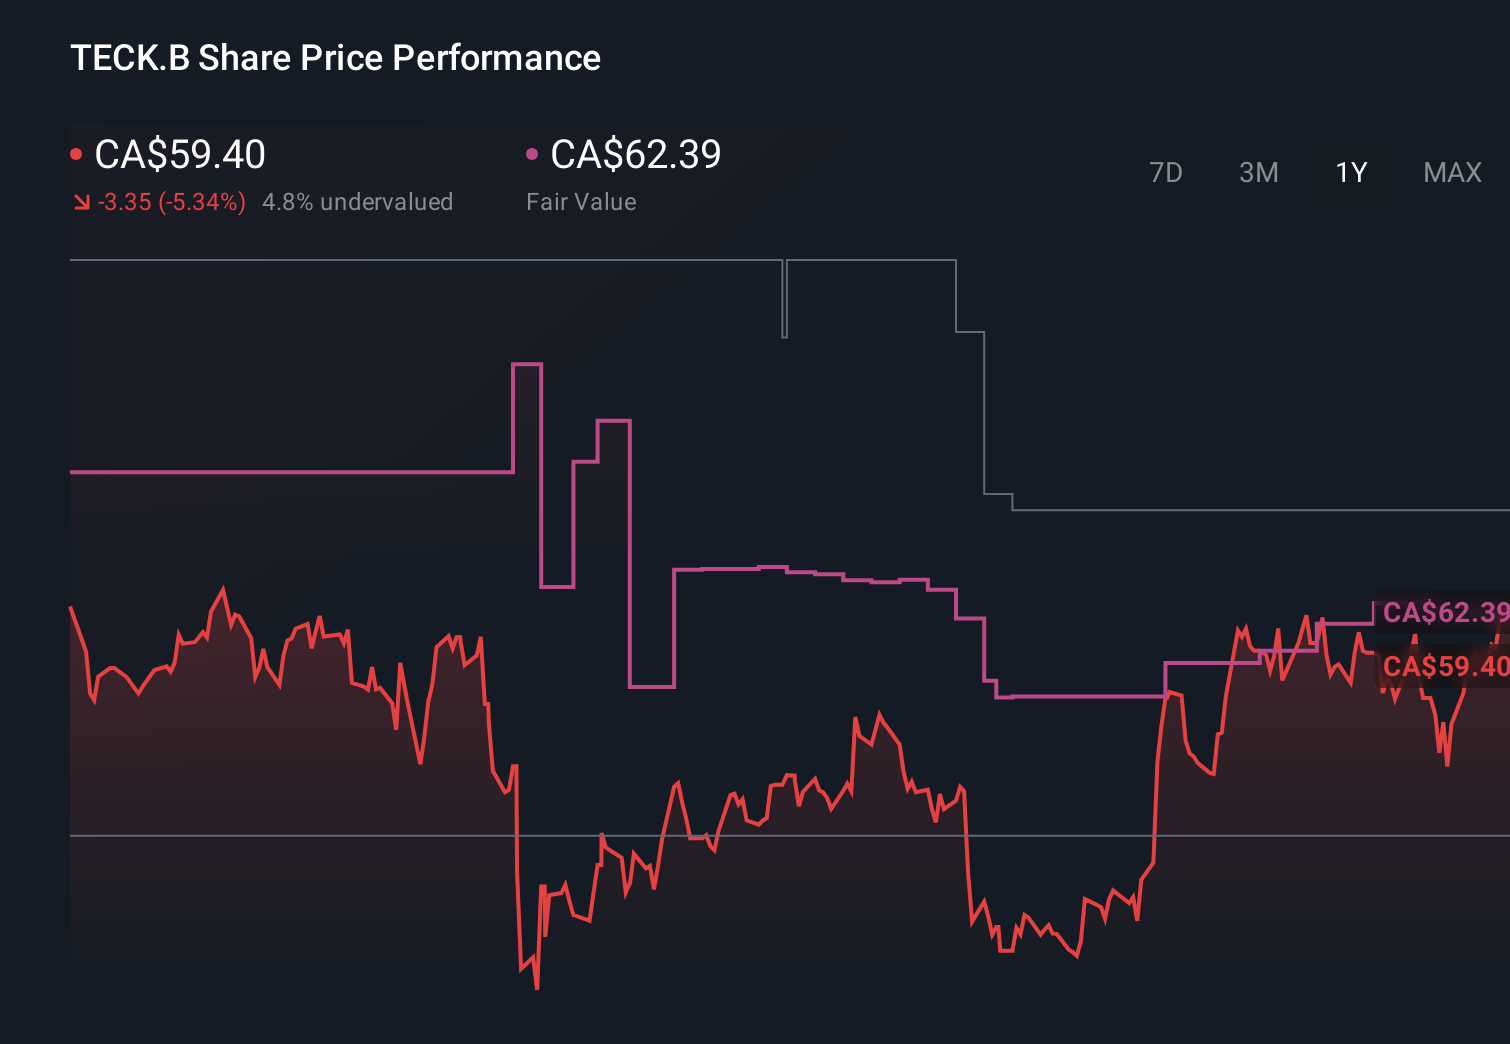
- The stock has slipped about 0.1% over the last week, but is still up 4.4% over the past month, 5.1% year to date and 183.3% over five years. This pattern hints at solid long term momentum, even with a 3.8% dip over the last year and a more volatile 26.5% gain over three years.
- Recent headlines have focused on Teck’s ongoing portfolio reshaping and strategic moves in its core metals and mining operations. This helps explain why investors are constantly revisiting what the business is worth. Broader themes around demand for metals tied to infrastructure and energy transition are also feeding into shifting expectations around both its growth prospects and risk profile.
- Right now Teck scores just 2/6 on our valuation checks. In the rest of this piece we will walk through what different valuation approaches say about the stock, and then finish with a more holistic way to judge whether the current price really makes sense.
Teck Resources scores just 2/6 on our valuation checks. See what other red flags we found in the full valuation breakdown.
Approach 1: Teck Resources Discounted Cash Flow (DCF) Analysis
A Discounted Cash Flow model estimates what a company is worth today by projecting the cash it can generate in the future and then discounting those amounts back to a present value.
For Teck Resources, the latest twelve months show free cash flow of about CA$2.49 billion outflow, reflecting a heavy investment phase. According to analysts and extrapolations, free cash flow is projected to reach roughly CA$3.31 billion by 2035. These projections follow a two stage Free Cash Flow to Equity approach, starting with analyst estimates through 2029 and then using gradually moderating growth assumptions beyond that, all in CA$.
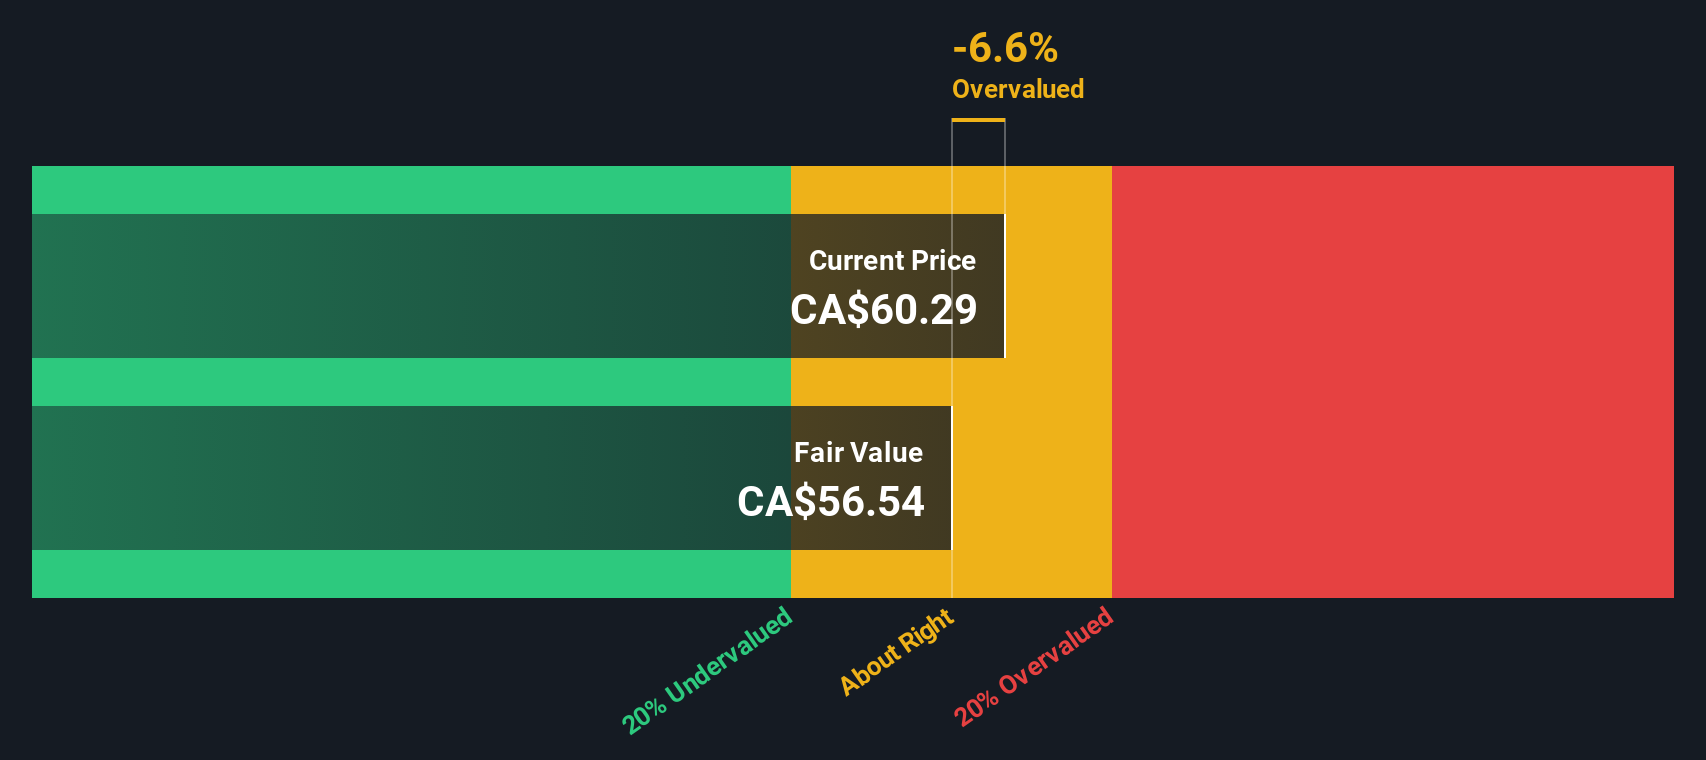
When these future cash flows are discounted back, the analysis results in an intrinsic value of about CA$96.38 per share. Compared with the current share price around CA$61.95, the model indicates that Teck trades at roughly a 35.7% discount, which would represent notable upside if the cash flow forecasts prove accurate.
Result: UNDERVALUED (model-based)
Our Discounted Cash Flow (DCF) analysis suggests Teck Resources is undervalued by 35.7%. Track this in your watchlist or portfolio, or discover 895 more undervalued stocks based on cash flows.
Approach 2: Teck Resources Price vs Earnings
For a profitable business like Teck Resources, the price to earnings, or PE, ratio is a practical way to see what investors are paying for each dollar of current earnings. In general, faster growth and lower perceived risk justify a higher PE, while slower or more volatile earnings and higher risk usually align with a lower multiple.
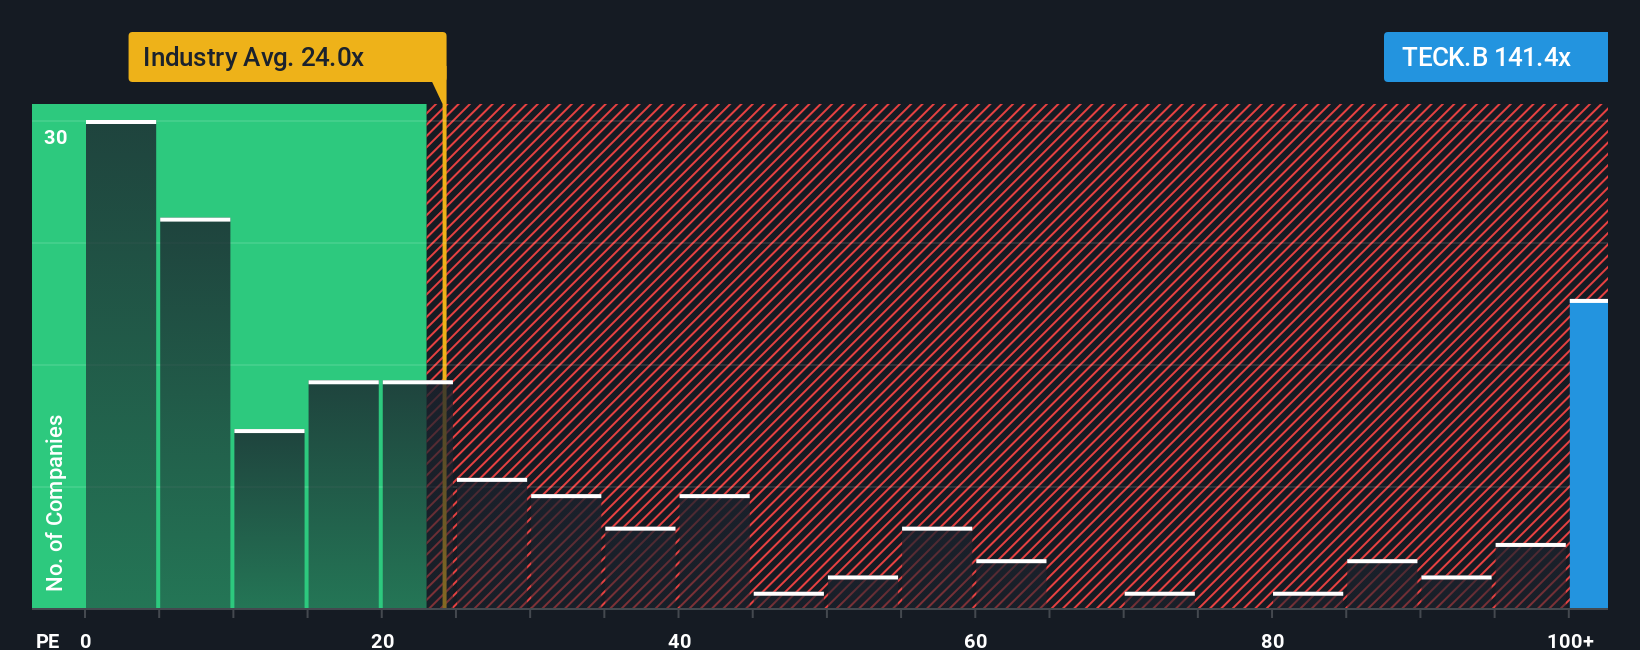
Teck currently trades on roughly 24.4x earnings, compared with about 21.2x for the broader Metals and Mining industry and around 20.9x for a key peer group. To go a step further, Simply Wall St calculates a proprietary Fair Ratio of 17.2x, which reflects what Teck’s PE might reasonably be, given its earnings growth profile, margins, industry, size and specific risk factors.
This Fair Ratio is more tailored than a simple peer or industry comparison, because it adjusts for the fact that not all miners have the same growth runway, balance sheet strength or risk exposure. On that basis, Teck’s current PE of 24.4x sits noticeably above the 17.2x Fair Ratio, indicating that the market is already pricing in a relatively optimistic outlook.
Result: OVERVALUED
PE ratios tell one story, but what if the real opportunity lies elsewhere? Discover 1450 companies where insiders are betting big on explosive growth.
Upgrade Your Decision Making: Choose your Teck Resources Narrative
Earlier we mentioned that there is an even better way to understand valuation, so let us introduce you to Narratives, a simple way to connect your view of Teck’s story with a concrete forecast and a fair value estimate inside Simply Wall St’s Community page, which is used by millions of investors.
A Narrative is where you spell out your assumptions about Teck’s future revenues, margins and risks, turn those into projected earnings and cash flows, and then translate that into what you believe is a fair value per share.
Because Narratives join the company’s story to a living financial model, they make it easier to compare your fair value estimate with today’s price by directly linking your assumptions to the current market valuation. They also automatically update when new information such as earnings, news, commodity moves or merger developments comes in.
For example, one Teck Narrative might lean bullish, assuming copper demand from electrification, successful Anglo integration and stronger margins to support a fair value above CA$68, while a more cautious Narrative could focus on project delays, commodity volatility and integration risk to justify a fair value closer to CA$47. This gives you a clear, numbers backed way to see which story you actually believe.
Do you think there's more to the story for Teck Resources? Head over to our Community to see what others are saying!
This article by Simply Wall St is general in nature. We provide commentary based on historical data and analyst forecasts only using an unbiased methodology and our articles are not intended to be financial advice. It does not constitute a recommendation to buy or sell any stock, and does not take account of your objectives, or your financial situation. We aim to bring you long-term focused analysis driven by fundamental data. Note that our analysis may not factor in the latest price-sensitive company announcements or qualitative material. Simply Wall St has no position in any stocks mentioned.
Have feedback on this article? Concerned about the content? Get in touch with us directly. Alternatively, email editorial-team@simplywallst.com