
Is It Too Late To Consider Goldman Sachs After Its 52.5% Surge This Year?
- If you are wondering whether Goldman Sachs Group is still worth considering after its huge run, or if you would just be paying up for past success, this article will walk through what the numbers are really saying about its valuation.
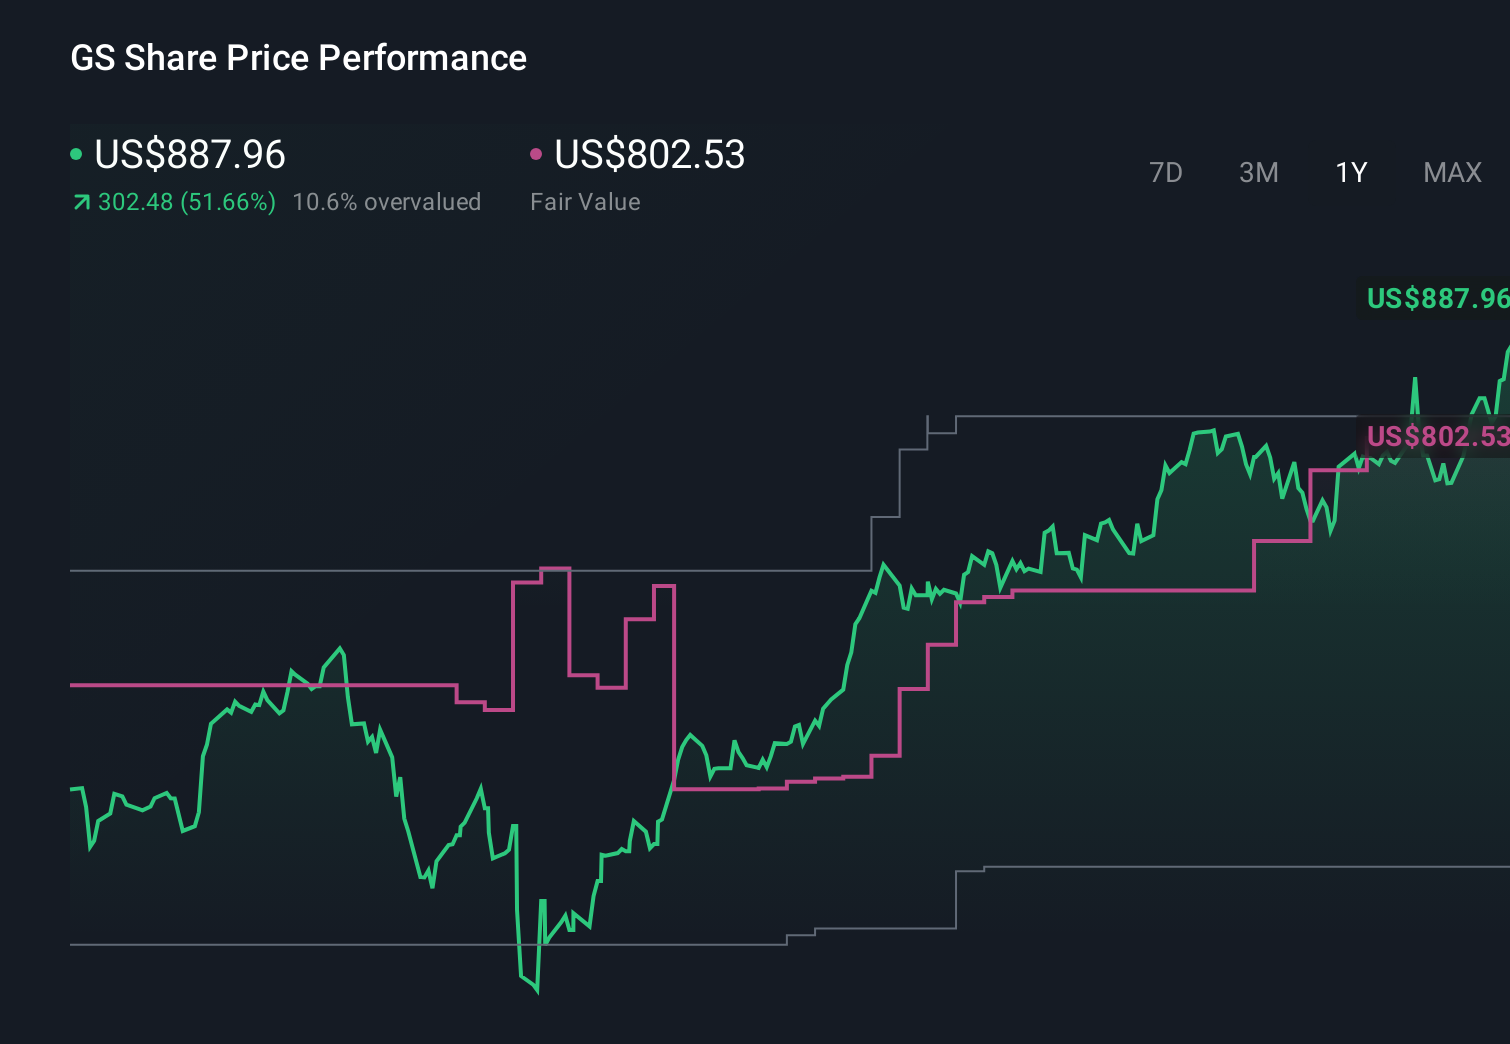
- Goldman Sachs shares recently closed at $876.58, after climbing 4.8% over the last week, 10.0% over the last month, and 52.5% year to date, adding to 50.9% over the past year and 304.9% over five years, which has clearly reset investor expectations.
- Behind those moves, markets have been reacting to a mix of upbeat sentiment around investment banking and trading activity, ongoing cost discipline, and optimism that deal making and capital markets remain on a stronger footing. Regulatory developments, macro signals from the Federal Reserve, and renewed interest in financial stocks have also helped frame Goldman as a leveraged play on a more constructive backdrop for Wall Street.
- Despite that momentum, Goldman Sachs carries a valuation score of 3/6, meaning it screens as undervalued on only half of the key checks used here. Next, this article unpacks how different valuation methods judge the stock, before finishing with a more holistic way to think about what it might really be worth.
Approach 1: Goldman Sachs Group Excess Returns Analysis
The Excess Returns model looks at how much profit Goldman Sachs Group can generate over and above the return investors demand on its equity capital, then capitalises that stream of excess value into an intrinsic share price.
In this framework, Goldman is assumed to have a Book Value of $348.02 per share, rising to a Stable Book Value of $384.49 per share over time, based on forecasts from 15 analysts. Its Stable EPS is estimated at $58.46 per share, derived from expected returns on equity from 13 analysts. With a Cost of Equity of $48.06 per share, that implies an Excess Return of $10.40 per share, supported by an Average Return on Equity of 15.20%.
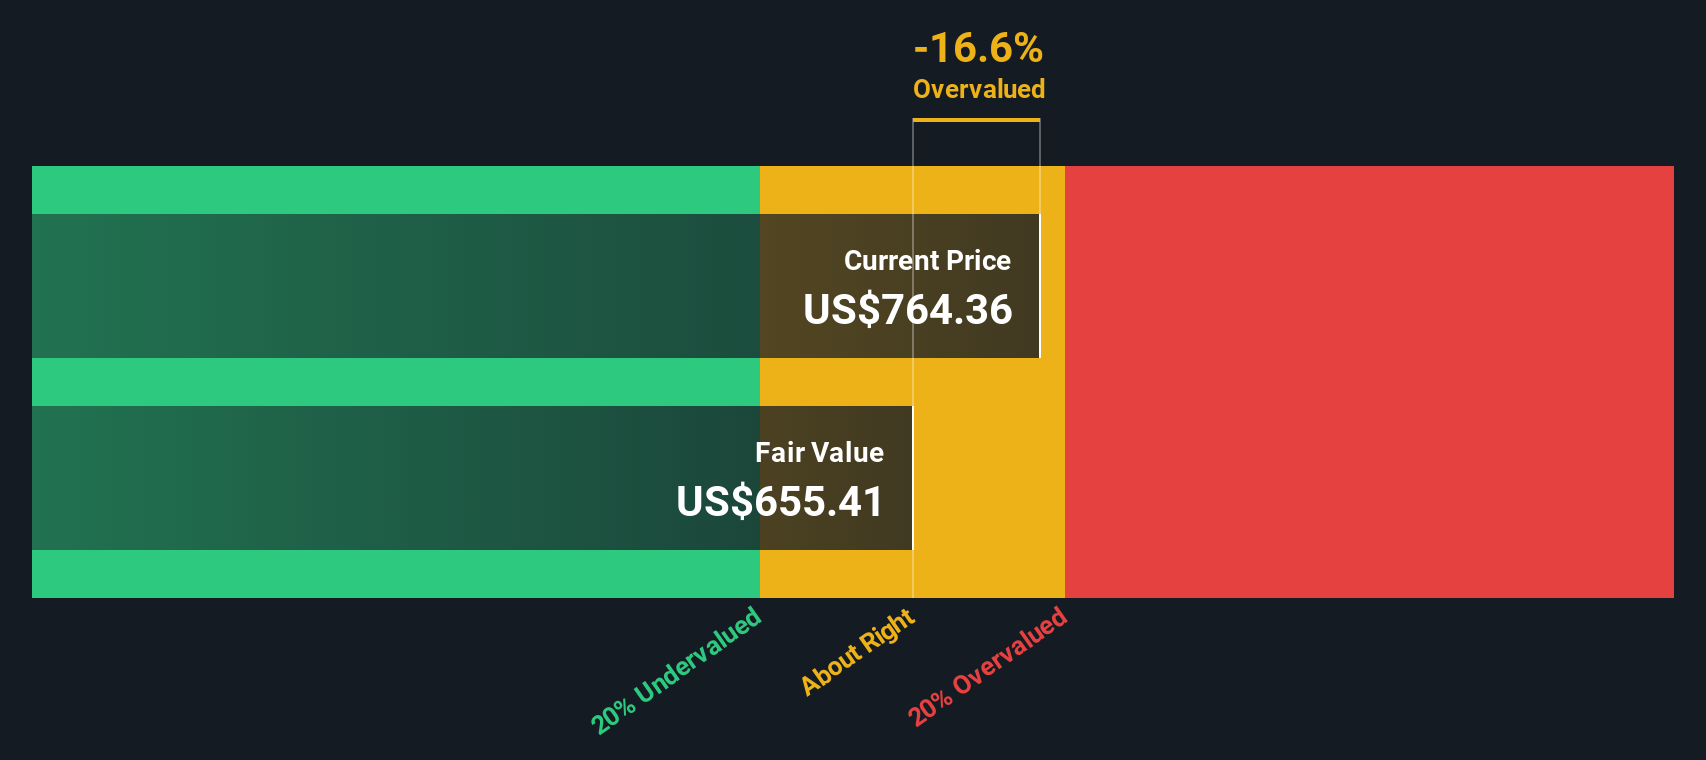
When these ongoing excess returns are projected and discounted, the model arrives at an intrinsic value of about $497 per share. Compared with the recent share price of $876.58, this implies the stock is roughly 76.4% overvalued on this method.
Result: OVERVALUED
Our Excess Returns analysis suggests Goldman Sachs Group may be overvalued by 76.4%. Discover 900 undervalued stocks or create your own screener to find better value opportunities.
Approach 2: Goldman Sachs Group Price vs Earnings
For a profitable, relatively mature business like Goldman Sachs, the price to earnings multiple is a useful way to gauge what investors are willing to pay for each dollar of current profits. A higher PE ratio typically reflects stronger growth expectations and lower perceived risk, while a lower PE suggests more modest growth or higher uncertainty, so what counts as a normal or fair PE will vary by company and industry.
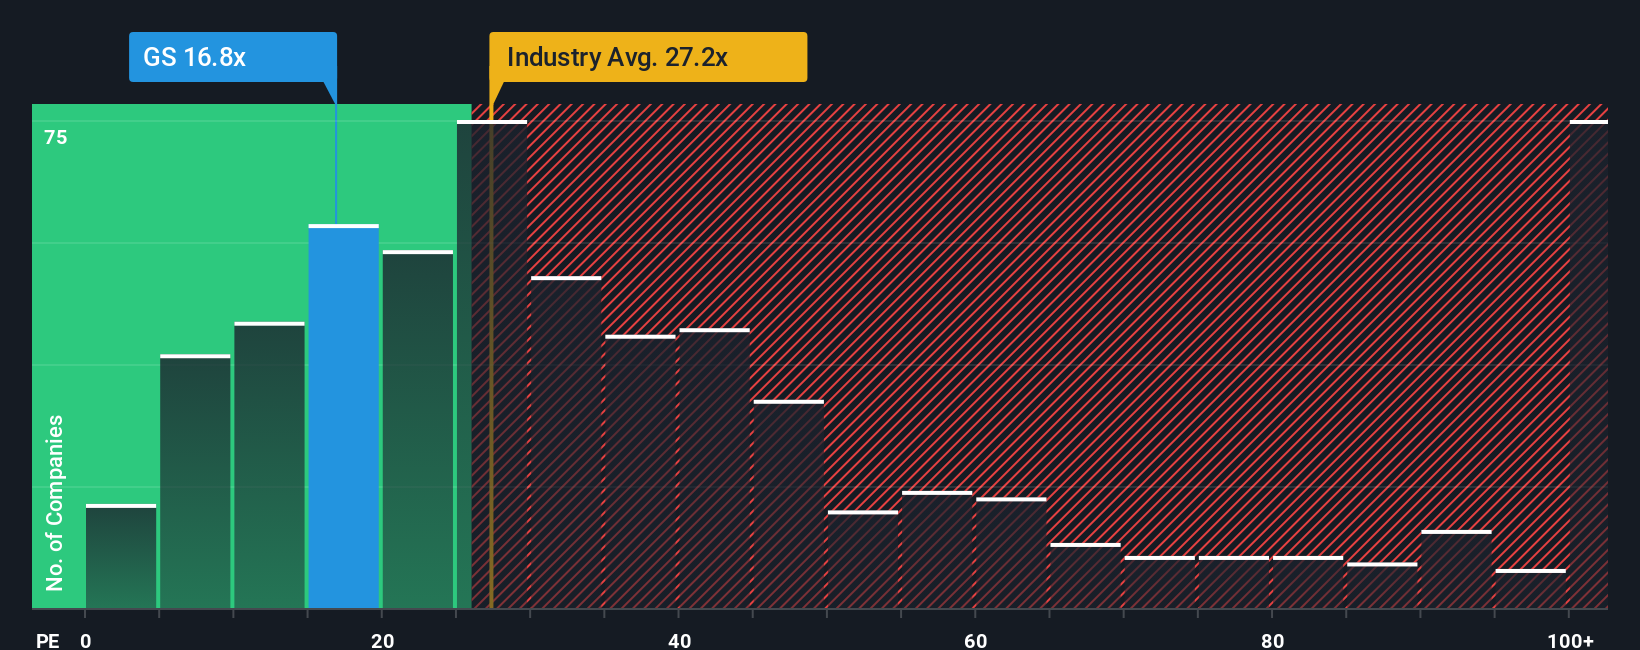
Goldman currently trades on a PE of 17.42x, which is below both the Capital Markets industry average of about 25.28x and the broader peer group average of around 31.82x. Simply Wall St also calculates a Fair Ratio of 19.18x for Goldman, which is the PE you might expect given its specific earnings growth profile, profitability, size, industry positioning and risk factors.
This Fair Ratio is more tailored than a simple comparison with peers or the sector, because it adjusts for company level drivers like margins, growth runway and balance sheet risk, rather than assuming all financial stocks deserve the same multiple. On this basis, Goldman appears modestly undervalued, with its actual PE sitting below the Fair Ratio.
Result: UNDERVALUED
PE ratios tell one story, but what if the real opportunity lies elsewhere? Discover 1447 companies where insiders are betting big on explosive growth.
Upgrade Your Decision Making: Choose your Goldman Sachs Group Narrative
Earlier we mentioned that there is an even better way to understand valuation, so let us introduce you to Narratives, a simple way to connect your view of Goldman Sachs Group’s future with a set of numbers for revenue, earnings, margins and a fair value estimate. A Narrative is your story behind the numbers, linking how you think the business will evolve to a financial forecast, and then to a fair value that you can compare against today’s share price to decide whether to buy, hold, or sell. On Simply Wall St’s Community page, millions of investors use Narratives as an accessible tool that automatically updates when new information, such as fresh earnings or major news, changes the outlook. For Goldman, one investor might build a more optimistic Narrative around sustained M&A strength, scalable asset and wealth management, and AI driven efficiency that supports a fair value closer to the higher analyst targets, while another could focus on regulatory and fee compression risks and land nearer the lower targets, and both perspectives are instantly translated into updated fair values that move with the latest data.
Do you think there's more to the story for Goldman Sachs Group? Head over to our Community to see what others are saying!
This article by Simply Wall St is general in nature. We provide commentary based on historical data and analyst forecasts only using an unbiased methodology and our articles are not intended to be financial advice. It does not constitute a recommendation to buy or sell any stock, and does not take account of your objectives, or your financial situation. We aim to bring you long-term focused analysis driven by fundamental data. Note that our analysis may not factor in the latest price-sensitive company announcements or qualitative material. Simply Wall St has no position in any stocks mentioned.
Have feedback on this article? Concerned about the content? Get in touch with us directly. Alternatively, email editorial-team@simplywallst.com