
Evaluating HORIBA (TSE:6856)’s Valuation After Its Strong Recent Share Price Momentum
HORIBA (TSE:6856) has been quietly building momentum, with the share price up around 16% over the past month and more than 80% over the past year. This has drawn fresh attention to its valuation.
See our latest analysis for HORIBA.
With the share price now around ¥15,980, HORIBA’s strong 30 day and year to date share price returns, alongside an impressive multi year total shareholder return, point to clear positive momentum as investors reassess its growth and risk profile.
If HORIBA’s run has you rethinking your watchlist, this could be a good moment to explore other high growth tech names and discover high growth tech and AI stocks.
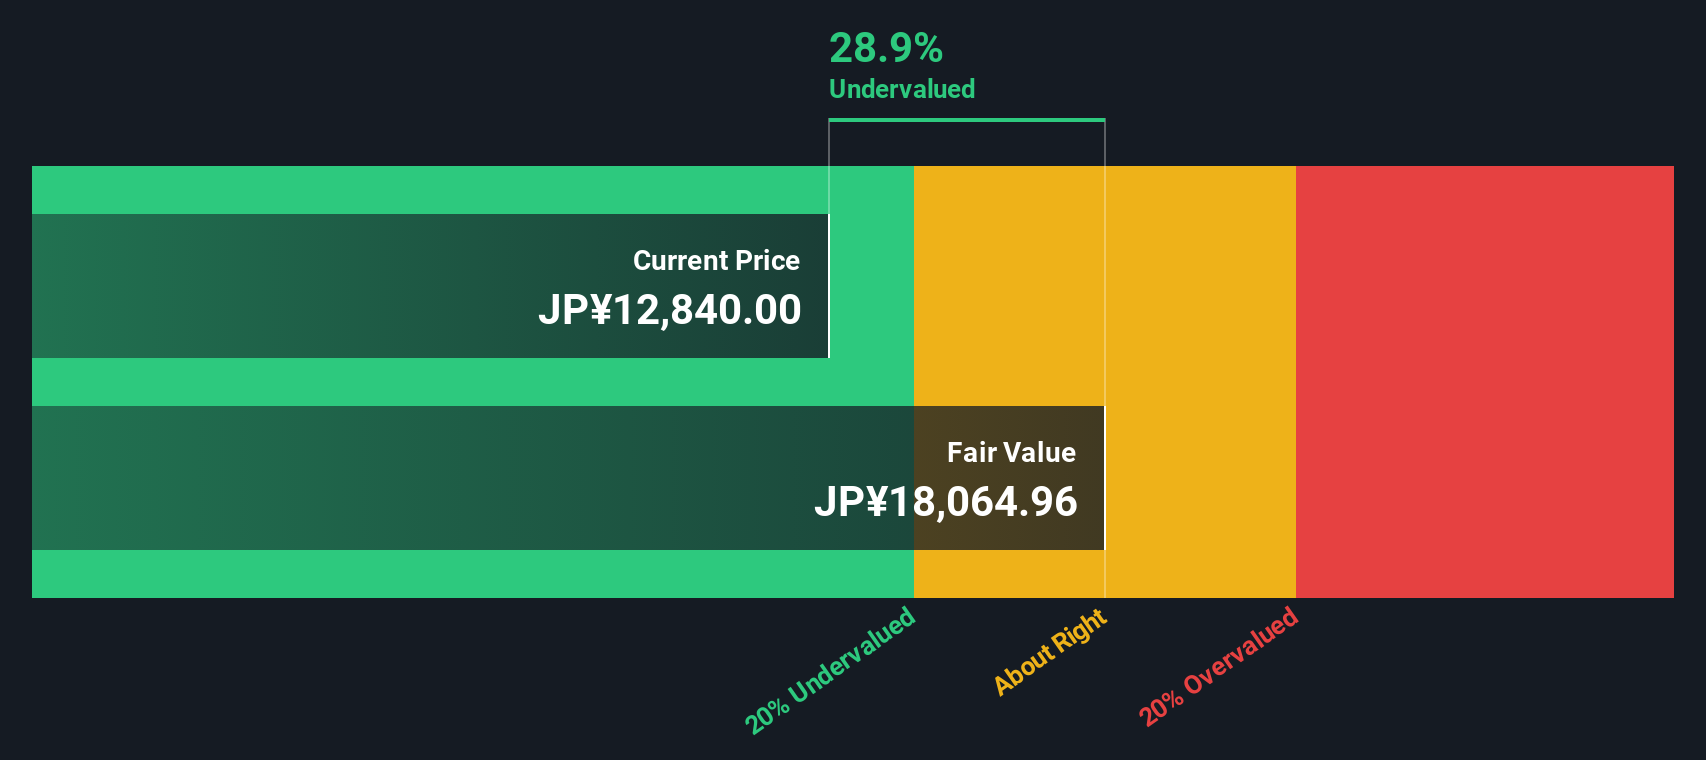
Given that HORIBA now trades slightly above the average analyst target yet still shows an estimated intrinsic value discount, investors face a key question: is there still a buying opportunity here, or is future growth already priced in?
Price to Earnings of 17.8x: Is it justified?
On a Price to Earnings ratio of 17.8x at a last close of ¥15,980, HORIBA screens modestly cheaper than similar peers but richer than the broader electronic industry.
The Price to Earnings multiple compares what investors are paying today for each unit of current earnings, a key yardstick for profitable, mature tech and industrial names such as HORIBA. A 17.8x multiple, combined with a record of earnings growth and high quality earnings, suggests the market is willing to pay a reasonable premium for its profit profile.
Compared to the peer average P E of 19x and an estimated fair P E of 18.8x, the current 17.8x level looks slightly conservative.
Explore the SWS fair ratio for HORIBA
Result: Price to Earnings of 17.8x (UNDERVALUED)
However, risks remain, including slowing revenue growth and the possibility that current optimism fades if earnings momentum or semiconductor demand unexpectedly cools.
Find out about the key risks to this HORIBA narrative.
Another View: What Our DCF Says
While the 17.8x earnings multiple hints at modest undervaluation, our DCF model is more upbeat, putting fair value near ¥17,955, about 11% above the current price. If cash flows matter more than today’s earnings snapshot, the upside may still be underestimated.
Look into how the SWS DCF model arrives at its fair value.
Simply Wall St performs a discounted cash flow (DCF) on every stock in the world every day (check out HORIBA for example). We show the entire calculation in full. You can track the result in your watchlist or portfolio and be alerted when this changes, or use our stock screener to discover 900 undervalued stocks based on their cash flows. If you save a screener we even alert you when new companies match - so you never miss a potential opportunity.
Build Your Own HORIBA Narrative
If you see things differently, or want to dig into the numbers yourself, you can craft a personalised view in just minutes using Do it your way.
A great starting point for your HORIBA research is our analysis highlighting 3 key rewards and 2 important warning signs that could impact your investment decision.
Ready for more investment ideas?
Before momentum shifts again, arm yourself with fresh opportunities using the Simply Wall St Screener, so you are never chasing the market from behind.
- Capture potential multi baggers early by scanning these 3597 penny stocks with strong financials that already show robust balance sheets and improving fundamentals.
- Position your portfolio for structural growth by targeting these 26 AI penny stocks harnessing breakthroughs in automation, data analytics, and intelligent software.
- Lock in income and stability by focusing on these 12 dividend stocks with yields > 3% that combine solid yields with sustainable payout ratios and resilient cash flows.
This article by Simply Wall St is general in nature. We provide commentary based on historical data and analyst forecasts only using an unbiased methodology and our articles are not intended to be financial advice. It does not constitute a recommendation to buy or sell any stock, and does not take account of your objectives, or your financial situation. We aim to bring you long-term focused analysis driven by fundamental data. Note that our analysis may not factor in the latest price-sensitive company announcements or qualitative material. Simply Wall St has no position in any stocks mentioned.
Have feedback on this article? Concerned about the content? Get in touch with us directly. Alternatively, email editorial-team@simplywallst.com