
REV Group (REVG) Margin Compression Reinforces Bearish Narrative Despite Solid EPS Growth
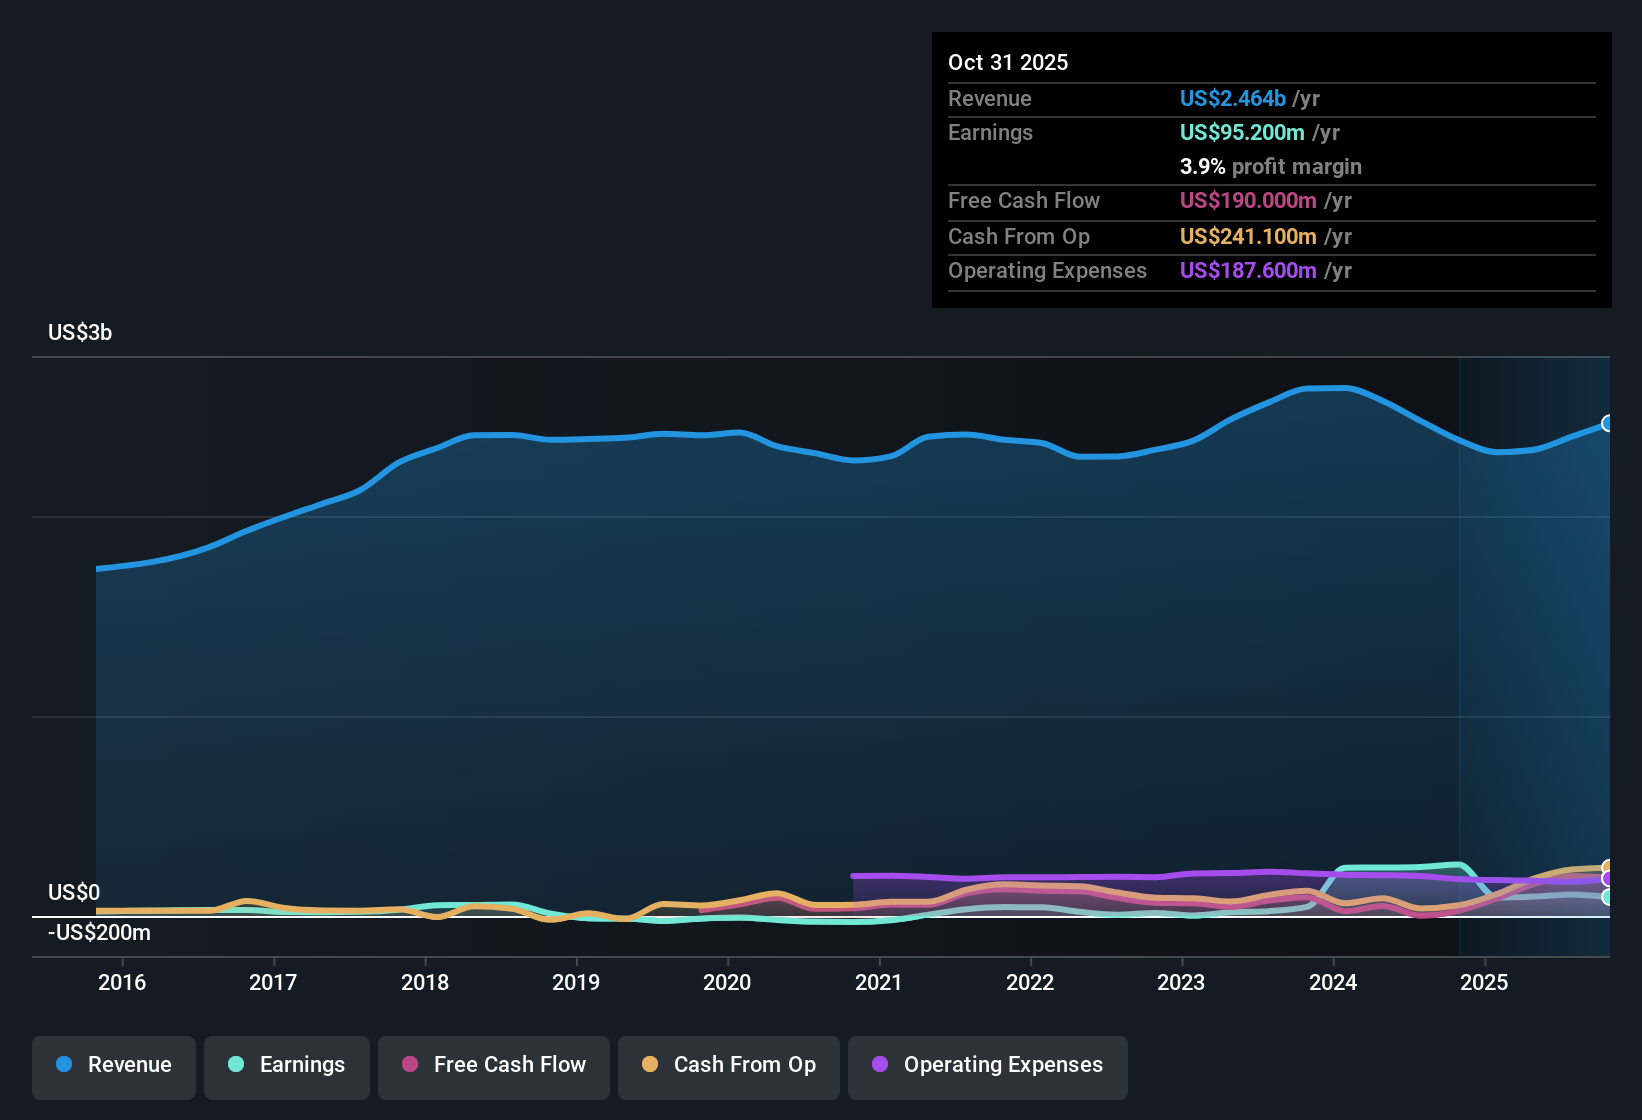
REV Group (REVG) just posted its FY 2025 third quarter numbers, with revenue at $644.9 million and basic EPS of about $0.60, alongside trailing twelve month revenue of roughly $2.4 billion and EPS of about $2.14. The company has seen quarterly revenue move from $579.4 million in FY 2024 Q3 to $644.9 million in FY 2025 Q3, while basic EPS has shifted from roughly $0.35 to $0.60 over the same stretch. This sets up a results season where investors are watching how much of that topline is translating into durable profitability as margins come under closer scrutiny.
See our full analysis for REV Group.With the latest figures on the table, the next step is to see how this margin picture and earnings trajectory line up with the dominant narratives around REV Group and where those stories might need updating.
See what the community is saying about REV Group
Margins Slide From 9.9% To 4.5%
- Trailing net income over the last twelve months was $108 million on $2.4 billion of revenue, implying a 4.5% net margin compared with 9.9% a year earlier.
- Bears argue that narrower focus and cost pressures will crimp profitability, and the margin data partly backs them up:
- Trailing net income dropped from $257.6 million to $108 million, even though revenue was roughly stable around the $2.4 billion level, which aligns with concerns about cost inflation eating into profits.
- At the same time, quarterly net income has moved from $18 million in FY 2024 Q3 to $29.1 million in FY 2025 Q3, so the recent quarter shows better profitability than last year even as the full year picture looks weaker.
Earnings Growth Outpaces Revenue
- Analysts expect earnings to grow about 15.7% per year while revenue is forecast to rise roughly 5.3% annually, with earnings projected to reach $218 million by around 2028 from $108 million today.
- Supporters of the bullish view point to this spread between earnings and revenue growth as evidence of improving efficiency:
- Recent quarterly numbers show net income increasing from $19 million in FY 2025 Q2 to $29.1 million in Q3 on only a modest revenue move from $629.1 million to $644.9 million, consistent with the idea of better conversion of sales into profit.
- Looking back a year, net income has grown from $18 million in FY 2024 Q3 to $29.1 million in FY 2025 Q3, which heavily supports the bullish case that operational tweaks and a more focused portfolio can lift earnings faster than sales.
Premium P E But DCF Upside
- At a share price of about $58.95 and a trailing P E of 26.6 times, the stock trades above the US Machinery industry average of 24.9 times and a peer average of 18.1 times, yet a DCF fair value of roughly $87.15 is around 32% higher.
- What stands out for the bullish narrative is the clash between premium multiples and modeled upside:
- Critics highlight the richer P E relative to industry and peers, arguing that margin slippage from 9.9% to 4.5% does not obviously justify paying more than the sector on simple earnings ratios.
- On the other hand, the DCF fair value sitting well above the current price, together with a five year annual earnings growth rate of 55%, gives bulls a numbers based argument that the stock might still offer upside despite screening expensive on near term P E.
Next Steps
To see how these results tie into long-term growth, risks, and valuation, check out the full range of community narratives for REV Group on Simply Wall St. Add the company to your watchlist or portfolio so you'll be alerted when the story evolves.
See the numbers from another angle and want to test that view fast? Turn it into your own structured story in minutes: Do it your way.
A great starting point for your REV Group research is our analysis highlighting 2 key rewards and 1 important warning sign that could impact your investment decision.
Explore Alternatives
REV Group’s shrinking net margin and premium valuation raise questions about how much investors are paying for earnings that still look vulnerable to pressure.
If you want ideas where valuation looks more forgiving and potential upside is clearer, use our these 900 undervalued stocks based on cash flows to quickly surface candidates that may offer better risk reward today.
This article by Simply Wall St is general in nature. We provide commentary based on historical data and analyst forecasts only using an unbiased methodology and our articles are not intended to be financial advice. It does not constitute a recommendation to buy or sell any stock, and does not take account of your objectives, or your financial situation. We aim to bring you long-term focused analysis driven by fundamental data. Note that our analysis may not factor in the latest price-sensitive company announcements or qualitative material. Simply Wall St has no position in any stocks mentioned.
Have feedback on this article? Concerned about the content? Get in touch with us directly. Alternatively, email editorial-team@simplywallst.com