
Is Wayfair’s 2025 Valuation Justified After a 103% Rally and Profitability Push?
- If you are wondering whether Wayfair’s sharp comeback makes it a bargain or a trap at today’s price, you are not alone. This article is designed to help you cut through the noise.
- The stock has pulled back about 2% over the last week and roughly 17.1% over the last month, but it is still up an eye catching 102.6% year to date and about 69.9% over the past year. This highlights both strong momentum and elevated risk.
- Recent headlines have focused on Wayfair’s push to streamline operations and sharpen its path to sustainable profitability, including cost discipline and a tighter focus on higher value customers. Investors have also reacted to broader shifts in consumer spending, with home related discretionary names moving in and out of favor as macro expectations change.
- On our framework, Wayfair scores a 3/6 valuation check, suggesting it looks undervalued on some metrics but not others. Next, we will walk through those different valuation angles before finishing with a more holistic way to make sense of what “fair value” really means for this stock.
Approach 1: Wayfair Discounted Cash Flow (DCF) Analysis
A Discounted Cash Flow model estimates what a company is worth by projecting the cash it could generate in the future and discounting those cash flows back to today in $ terms. For Wayfair, the model starts from last twelve month free cash flow of about $205.6 million and uses analyst forecasts for the next few years, then extends those trends further out using Simply Wall St assumptions.
Under this 2 Stage Free Cash Flow to Equity approach, Wayfair’s free cash flow is projected to grow to roughly $2.14 billion by 2035, implying substantial scaling from today’s levels as margins improve and the business matures. When all those future cash flows are discounted back, the model suggests an intrinsic value of about $178.54 per share.
Compared to the current share price, this implies the stock is trading at roughly a 47.7% discount to its estimated fair value, indicating that the market is pricing in considerably more risk or weaker execution than the DCF scenario assumes.
Result: UNDERVALUED
Our Discounted Cash Flow (DCF) analysis suggests Wayfair is undervalued by 47.7%. Track this in your watchlist or portfolio, or discover 906 more undervalued stocks based on cash flows.
Approach 2: Wayfair Price vs Sales
For a business like Wayfair that is still normalizing profitability, the Price to Sales ratio is a useful way to compare how much investors are paying for each dollar of revenue, especially when earnings can be volatile or negative. In general, faster growing and less risky companies can justify a higher sales multiple, while slower or riskier businesses tend to trade on a lower, more conservative multiple.
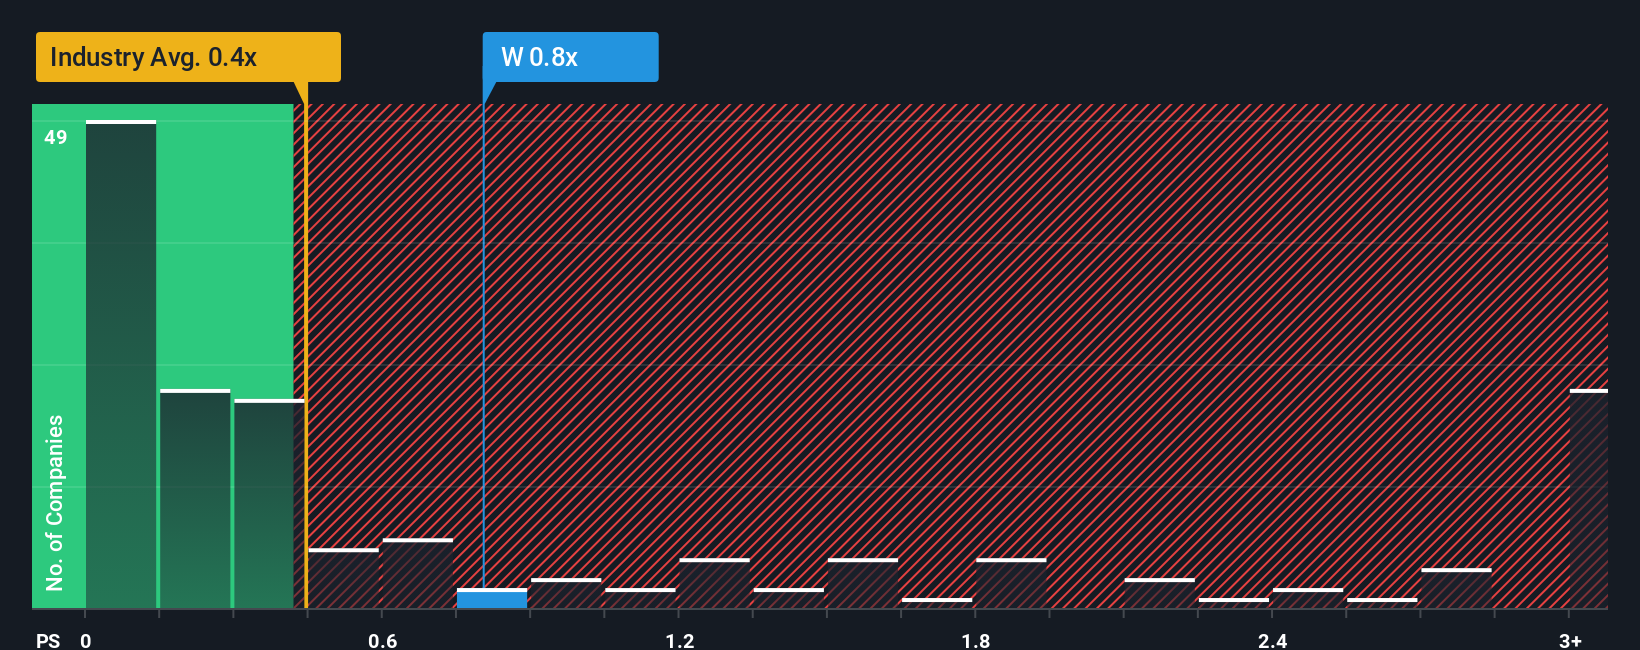
Wayfair currently trades on a Price to Sales ratio of about 1.0x, which is above the Specialty Retail industry average of roughly 0.53x but below the peer group average of around 1.31x. Simply Wall St also calculates a proprietary Fair Ratio of 0.72x, which represents the Price to Sales multiple that might be justified given Wayfair’s growth profile, margins, industry, market cap and specific risks.
This Fair Ratio is more tailored than a simple comparison with peers or the broad industry, because it explicitly adjusts for company specific drivers such as expected revenue growth, profitability improvements and business risk. Since Wayfair’s actual 1.0x multiple sits modestly above the 0.72x Fair Ratio, the stock screens as somewhat expensive on this measure.
Result: OVERVALUED
PS ratios tell one story, but what if the real opportunity lies elsewhere? Discover 1448 companies where insiders are betting big on explosive growth.
Upgrade Your Decision Making: Choose your Wayfair Narrative
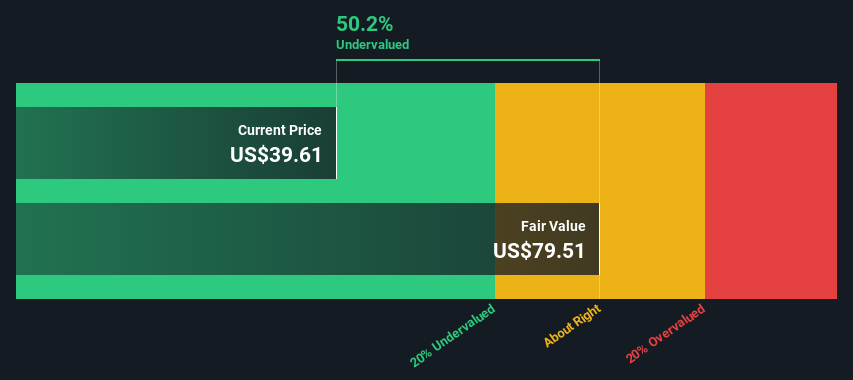
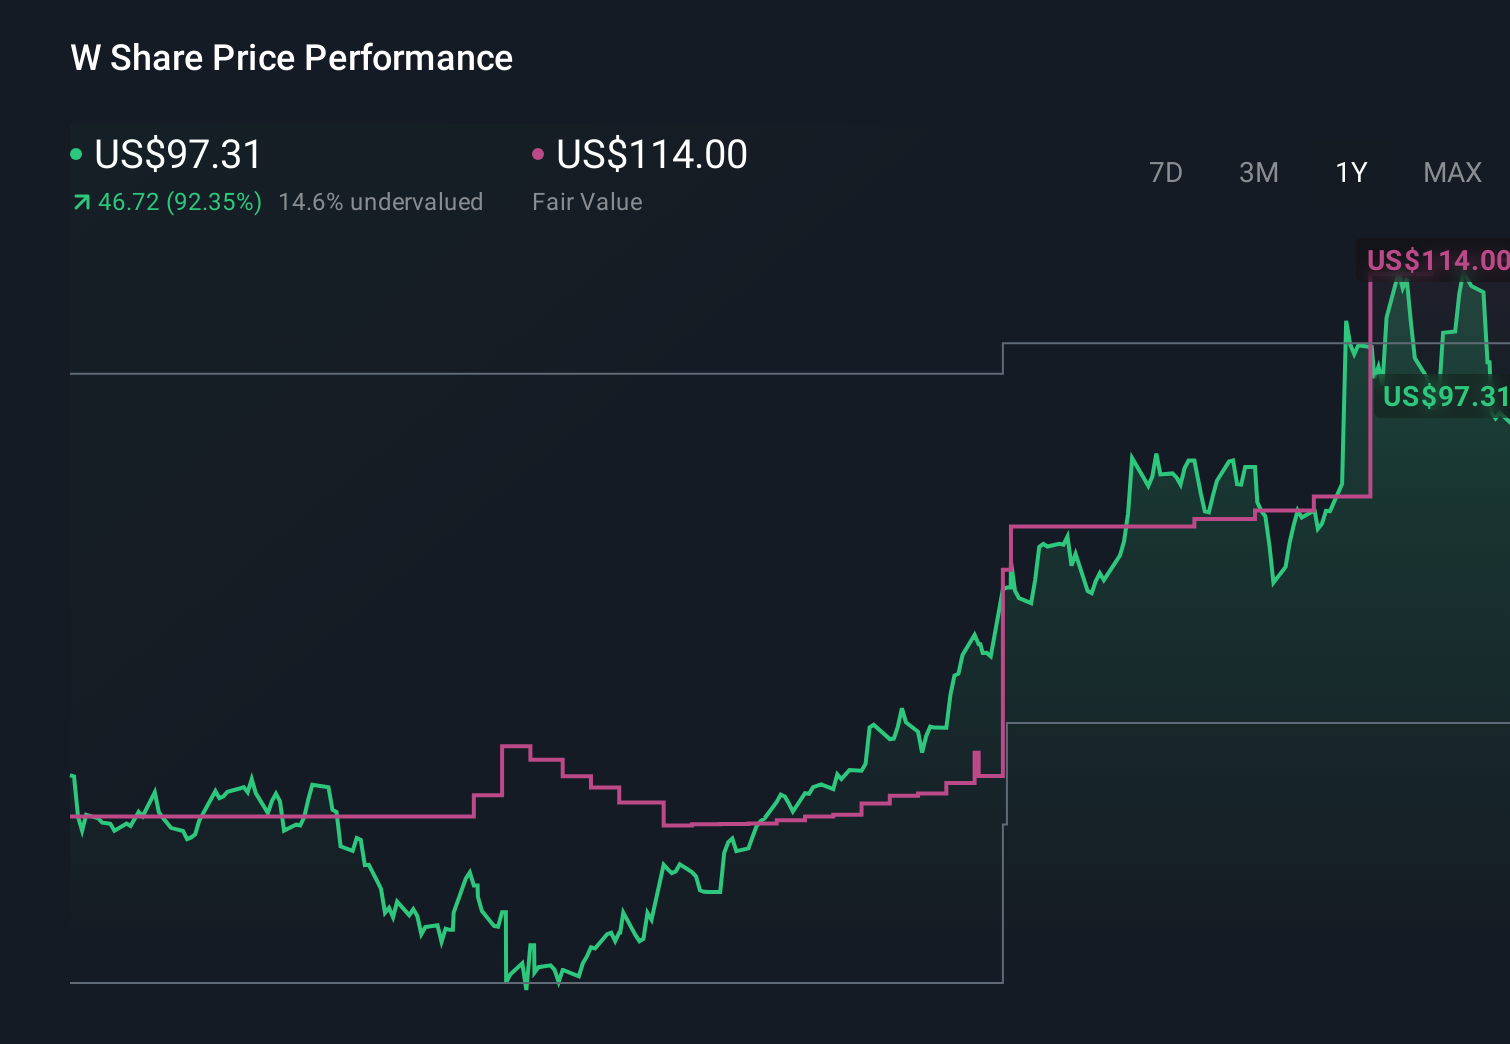
Earlier we mentioned that there is an even better way to understand valuation, so let us introduce you to Narratives, a simple way to connect your view of Wayfair’s story with the numbers by turning your assumptions about its future revenue, earnings and margins into a clear financial forecast and a fair value estimate. On Simply Wall St’s Community page, used by millions of investors, you can pick or create a Narrative that links what you believe about initiatives like CastleGate, new physical stores and share buybacks to a dynamic valuation that automatically updates as fresh news or earnings arrive. You can then compare that Fair Value to today’s share price to help decide whether to buy, hold or sell. This framework helps explain why some investors currently see Wayfair as worth closer to the bullish Narrative fair value of about $114 per share, while more cautious investors lean toward the lower analyst target of roughly $51, reflecting very different expectations for how the company’s strategy and risks will ultimately play out.
Do you think there's more to the story for Wayfair? Head over to our Community to see what others are saying!
This article by Simply Wall St is general in nature. We provide commentary based on historical data and analyst forecasts only using an unbiased methodology and our articles are not intended to be financial advice. It does not constitute a recommendation to buy or sell any stock, and does not take account of your objectives, or your financial situation. We aim to bring you long-term focused analysis driven by fundamental data. Note that our analysis may not factor in the latest price-sensitive company announcements or qualitative material. Simply Wall St has no position in any stocks mentioned.
Have feedback on this article? Concerned about the content? Get in touch with us directly. Alternatively, email editorial-team@simplywallst.com