
Is It Too Late To Consider MasTec After Its Recent 63.4% Rally?
- Wondering if MasTec is still a smart buy after its big run, or if the value has already been priced in? Let's break down what the numbers are really saying about the stock.
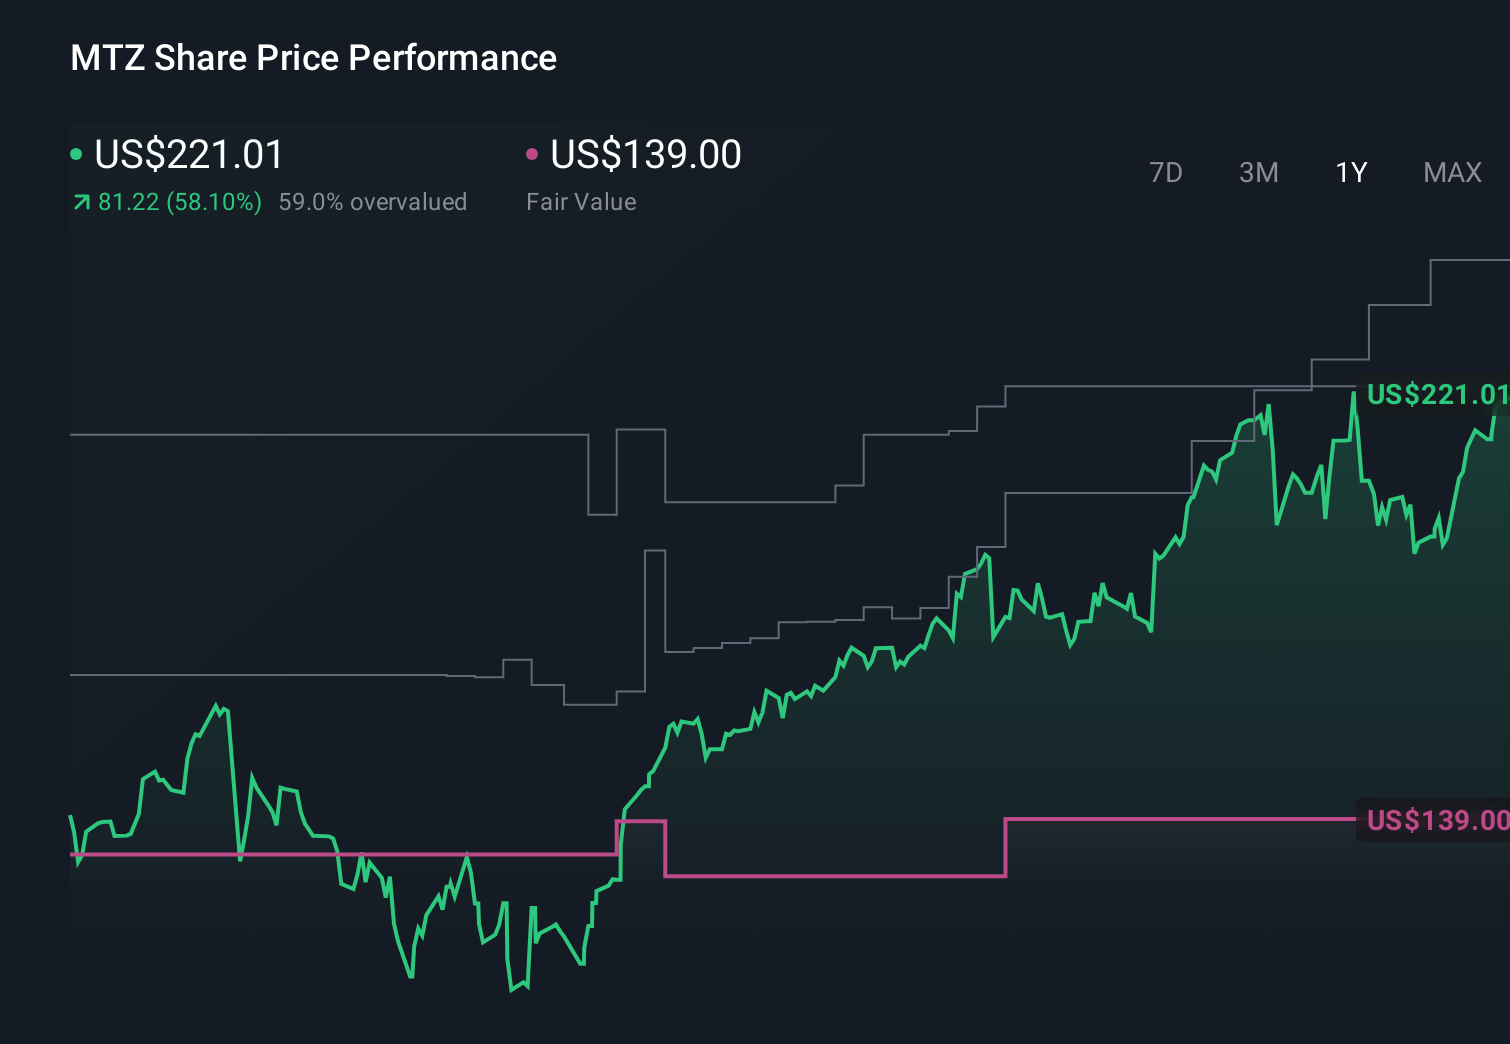
- MasTec has climbed 4.4% over the last week, 15.8% over the past month, and 63.4% year to date, with 1 year and 5 year gains of 66.5% and 247.5% that show this is no quiet compounder.
- Behind those moves, investors have been reacting to MasTec winning major infrastructure and energy transition contracts, alongside growing optimism around long term spending on grid modernization and renewable build outs. At the same time, broader market attention on capital goods and construction names has helped re rate companies that are seen as key beneficiaries of public and private investment cycles.
- Despite all that enthusiasm, MasTec only scores 1/6 on our valuation checks. In the rest of this piece we will walk through what different valuation approaches are telling us about the stock and hint at a more nuanced way to judge fair value that we will circle back to at the end.
MasTec scores just 1/6 on our valuation checks. See what other red flags we found in the full valuation breakdown.
Approach 1: MasTec Discounted Cash Flow (DCF) Analysis
A Discounted Cash Flow model estimates what a company is worth today by projecting its future cash flows and discounting them back to the present using a required return. For MasTec, the 2 Stage Free Cash Flow to Equity model starts with last twelve month free cash flow of about $435.8 million and uses analyst forecasts for the next few years, then extends those forecasts further into the future.
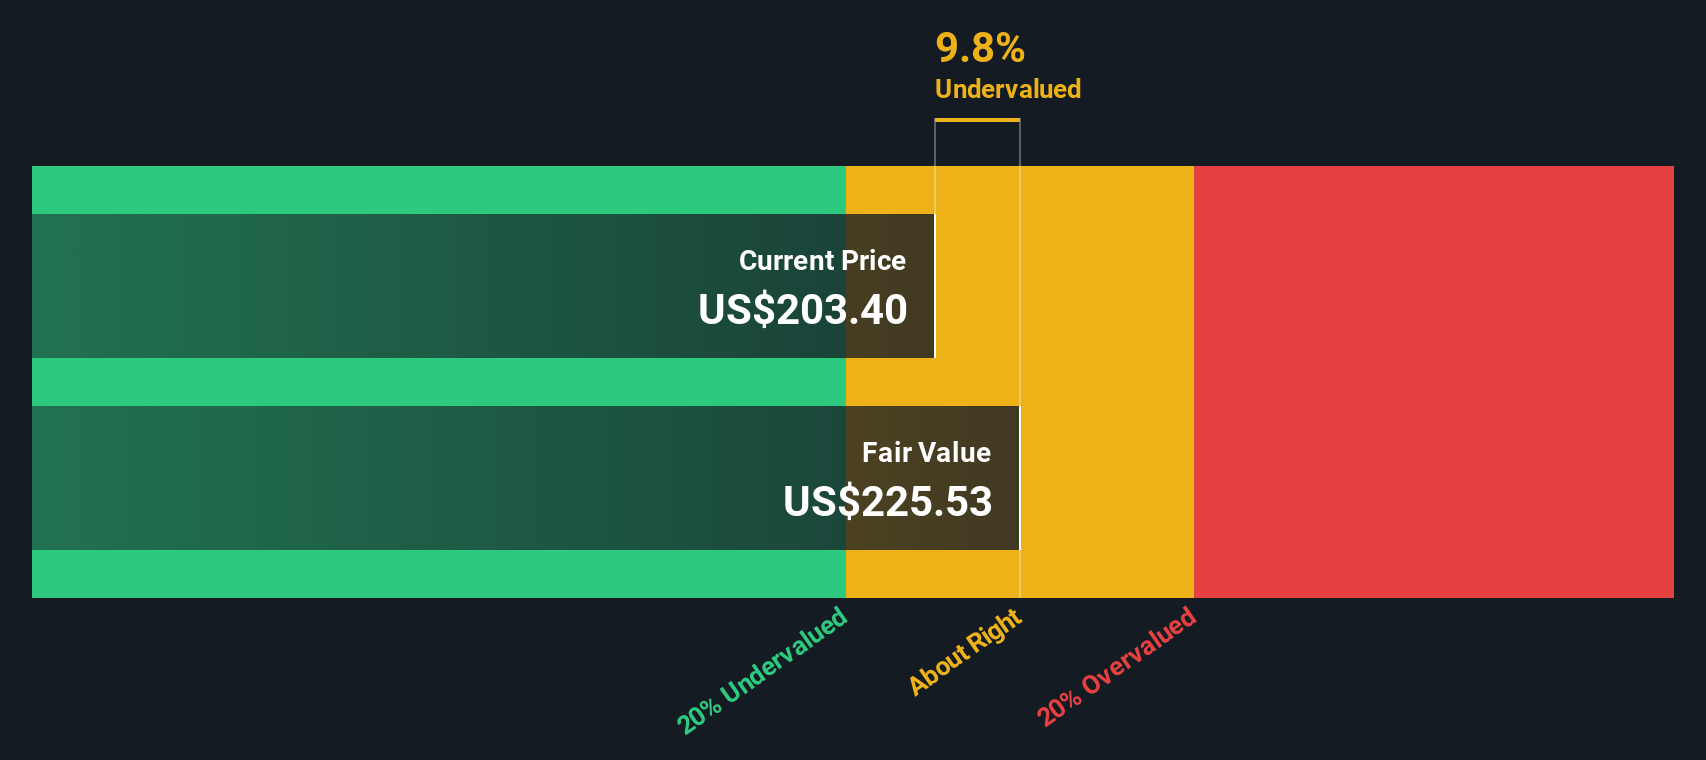
Analysts see free cash flow rising into the range of roughly $681.6 million in 2026 and $939 million by 2028, with Simply Wall St extrapolating this growth to around $1.54 billion by 2035. Aggregating and discounting these projected cash flows results in an estimated intrinsic value of $248.95 per share.
Compared with the current share price, this implies MasTec is trading at roughly an 8.1% discount to its DCF based fair value. This suggests the market is pricing the stock close to what its long term cash generation justifies.
Result: ABOUT RIGHT
MasTec is fairly valued according to our Discounted Cash Flow (DCF), but this can change at a moment's notice. Track the value in your watchlist or portfolio and be alerted on when to act.
Approach 2: MasTec Price vs Earnings
For a profitable company like MasTec, the price to earnings (PE) ratio is a useful way to gauge what investors are willing to pay today for each dollar of current earnings. In general, higher growth and lower risk justify a higher PE multiple, while slower or more uncertain earnings streams tend to deserve a lower one.
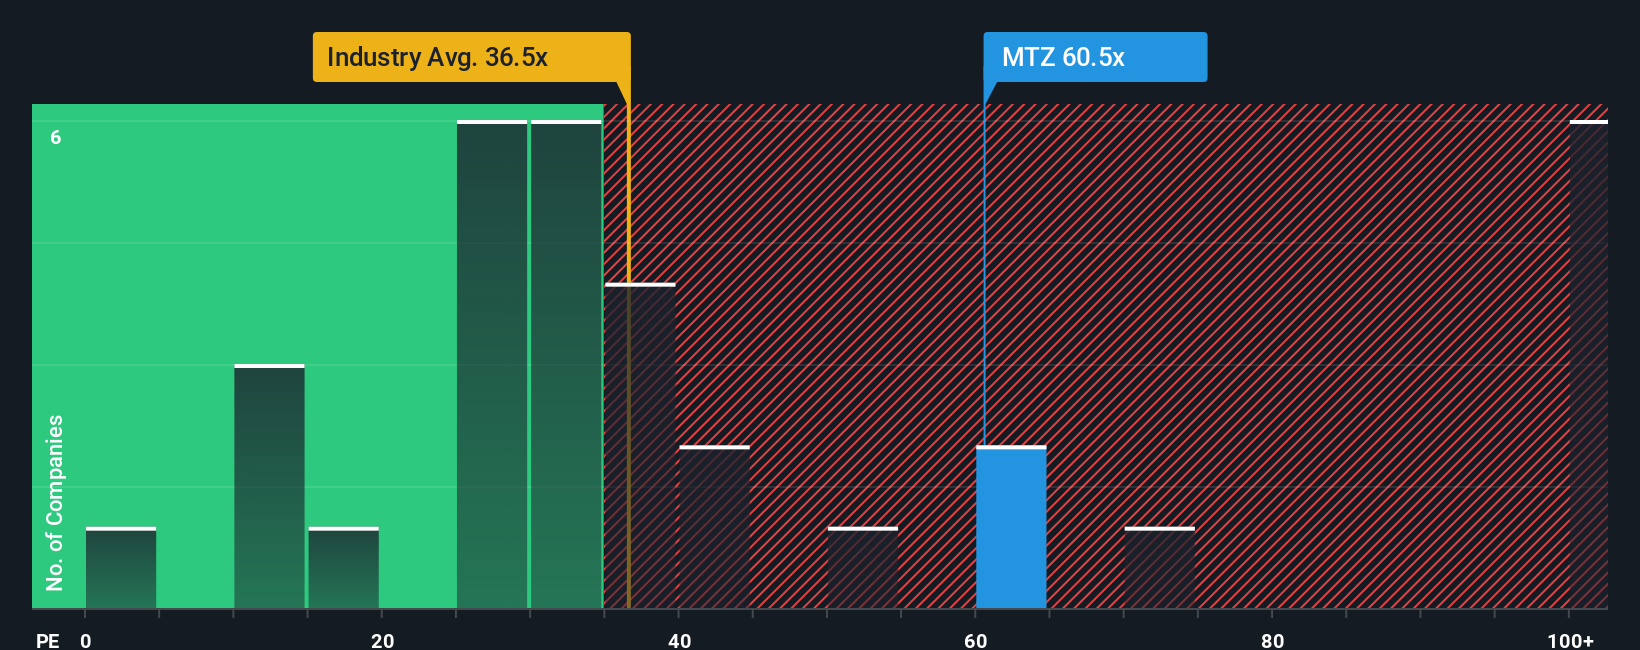
MasTec currently trades on a PE of about 53.7x. That is well above the broader Construction industry average of roughly 33.4x and also higher than the 48.5x average of its peer group, suggesting the market is already baking in strong growth and execution. To refine that view, Simply Wall St calculates a proprietary Fair Ratio of 39.9x, which estimates what MasTec’s PE should be given its specific growth outlook, risk profile, margins, industry and market cap. This tailored yardstick is more informative than simple peer or industry comparisons, because it adjusts for MasTec’s particular fundamentals rather than assuming all companies deserve similar multiples.
Comparing the Fair Ratio of 39.9x with the current 53.7x PE suggests MasTec is trading at a premium to what its fundamentals justify, indicating the stock looks somewhat expensive on earnings.
Result: OVERVALUED
PE ratios tell one story, but what if the real opportunity lies elsewhere? Discover 1446 companies where insiders are betting big on explosive growth.
Upgrade Your Decision Making: Choose your MasTec Narrative
Earlier we mentioned that there is an even better way to understand valuation, so let's introduce you to Narratives, a simple way to connect your view of MasTec's story with a concrete financial forecast and your own fair value estimate.
A Narrative is your personal storyline for a company, where you spell out what you think will happen to revenue, earnings and margins, then see how that story translates into a projected fair value today.
On Simply Wall St, Narratives live in the Community page and are designed to be accessible, so you do not need to be a modeling expert to plug in your assumptions and immediately see whether the stock looks undervalued or overvalued.
Because each Narrative links a story to a forecast and then to a fair value, it becomes a practical tool for comparing your fair value estimate to MasTec’s current price and tracking how much upside or downside you believe is left.
Narratives also update dynamically as new information like earnings, guidance or major contract wins comes in, so your view stays current. For example, one MasTec Narrative on Simply Wall St now pegs fair value around $140 based on more cautious growth and margin assumptions, while a more optimistic Narrative reaches about $290, reflecting expectations for stronger revenue growth, faster margin expansion and a higher justified multiple over time.
Do you think there's more to the story for MasTec? Head over to our Community to see what others are saying!
This article by Simply Wall St is general in nature. We provide commentary based on historical data and analyst forecasts only using an unbiased methodology and our articles are not intended to be financial advice. It does not constitute a recommendation to buy or sell any stock, and does not take account of your objectives, or your financial situation. We aim to bring you long-term focused analysis driven by fundamental data. Note that our analysis may not factor in the latest price-sensitive company announcements or qualitative material. Simply Wall St has no position in any stocks mentioned.
Have feedback on this article? Concerned about the content? Get in touch with us directly. Alternatively, email editorial-team@simplywallst.com