
BYD (SEHK:1211): Assessing Valuation After Recent Share Price Softness
BYD (SEHK:1211) has quietly slipped about 4% over the past month and roughly 7% in the past 3 months, which is exactly when long term investors start asking whether recent weakness is an opportunity.
See our latest analysis for BYD.
Despite the recent softness in its share price, BYD’s 13.11% year to date share price return and solid multi year total shareholder returns suggest momentum is pausing rather than breaking, as investors reassess growth and competitive risks around electric vehicles.
If this kind of reset in sentiment has you scanning the rest of the auto space, it could be a good moment to explore other auto manufacturers as potential opportunities.
With BYD still growing double digits on the top and bottom line and trading at a notable discount to analyst targets, the key question now is whether this is a genuine value gap or whether markets are already pricing in future growth.
Price-to-Earnings of 21x: Is it justified?
BYD shares last closed at HK$97.35, and on a price-to-earnings ratio of 21x they appear expensive relative to both peers and fair value benchmarks.
The price-to-earnings multiple compares the current share price to per share earnings. It is a core yardstick for profitable auto and battery manufacturers where investors pay for today’s and tomorrow’s earnings power.
In BYD’s case, a 21x multiple suggests the market is already factoring in robust profit growth. This sits well above the estimated fair P/E of 14.6x, indicating investors may be paying more than what the current fundamentals support.
That premium also stands out against the Asian Auto industry average of 18.6x and a lower peer average of 8.9x, which reinforces the view that BYD currently trades on a richer valuation than both the sector and comparable companies.
Explore the SWS fair ratio for BYD
Result: Price-to-Earnings of 21x (OVERVALUED).
However, several risks remain, including intensifying EV competition and potential margin pressure if battery input costs rise faster than BYD can pass through these costs.
Find out about the key risks to this BYD narrative.
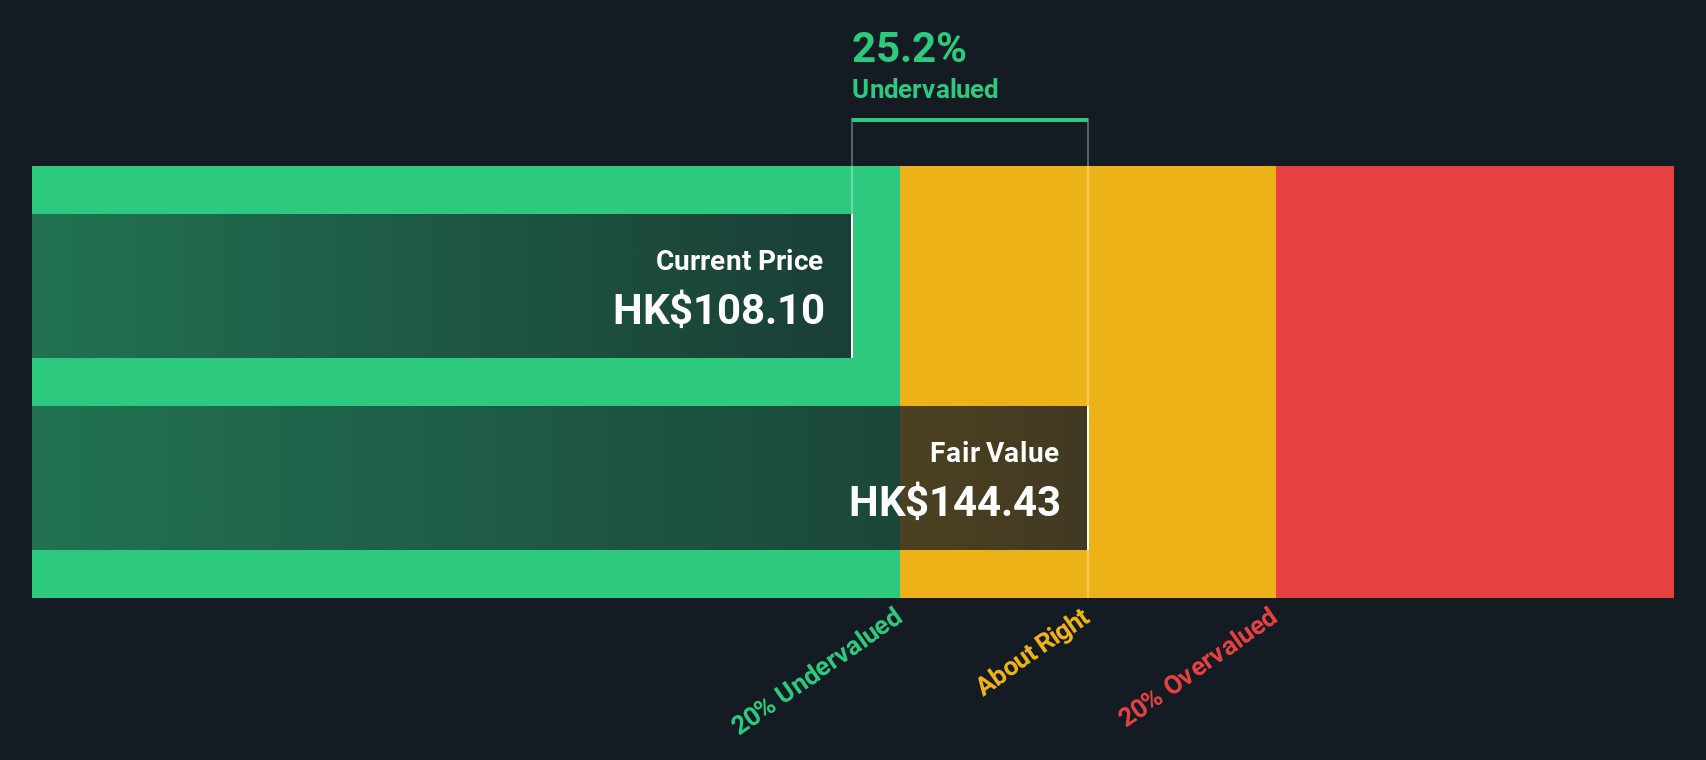
Another View: DCF Points to Undervaluation
Our DCF model suggests a fair value of about HK$111.46 per share, implying BYD is roughly 12.7% undervalued versus the current HK$97.35 price. That is a very different message from the rich 21x earnings multiple. Which signal should investors place more weight on?
Look into how the SWS DCF model arrives at its fair value.
Simply Wall St performs a discounted cash flow (DCF) on every stock in the world every day (check out BYD for example). We show the entire calculation in full. You can track the result in your watchlist or portfolio and be alerted when this changes, or use our stock screener to discover 908 undervalued stocks based on their cash flows. If you save a screener we even alert you when new companies match - so you never miss a potential opportunity.
Build Your Own BYD Narrative
If you see the numbers differently or want to dig into the data yourself, you can build a personalized view in just a few minutes: Do it your way.
A great starting point for your BYD research is our analysis highlighting 3 key rewards and 1 important warning sign that could impact your investment decision.
Looking for more timely stock ideas?
Before you move on, consider scanning fresh opportunities on Simply Wall Street, where data driven screeners surface stocks most investors overlook.
- Explore potential value by reviewing these 908 undervalued stocks based on cash flows that the market has not fully appreciated yet.
- Focus on powerful technology shifts by targeting these 26 AI penny stocks shaping the next wave of intelligent automation.
- Support long term income potential by reviewing these 12 dividend stocks with yields > 3% that may bolster your portfolio’s cash returns.
This article by Simply Wall St is general in nature. We provide commentary based on historical data and analyst forecasts only using an unbiased methodology and our articles are not intended to be financial advice. It does not constitute a recommendation to buy or sell any stock, and does not take account of your objectives, or your financial situation. We aim to bring you long-term focused analysis driven by fundamental data. Note that our analysis may not factor in the latest price-sensitive company announcements or qualitative material. Simply Wall St has no position in any stocks mentioned.
Have feedback on this article? Concerned about the content? Get in touch with us directly. Alternatively, email editorial-team@simplywallst.com