
Is Aurora Innovation a Smart Bet After 265.9% Three Year Surge?
- Wondering if Aurora Innovation at around $4.50 is a bargain or a bubble? You are not alone, and it is exactly the kind of stock where valuation really matters.
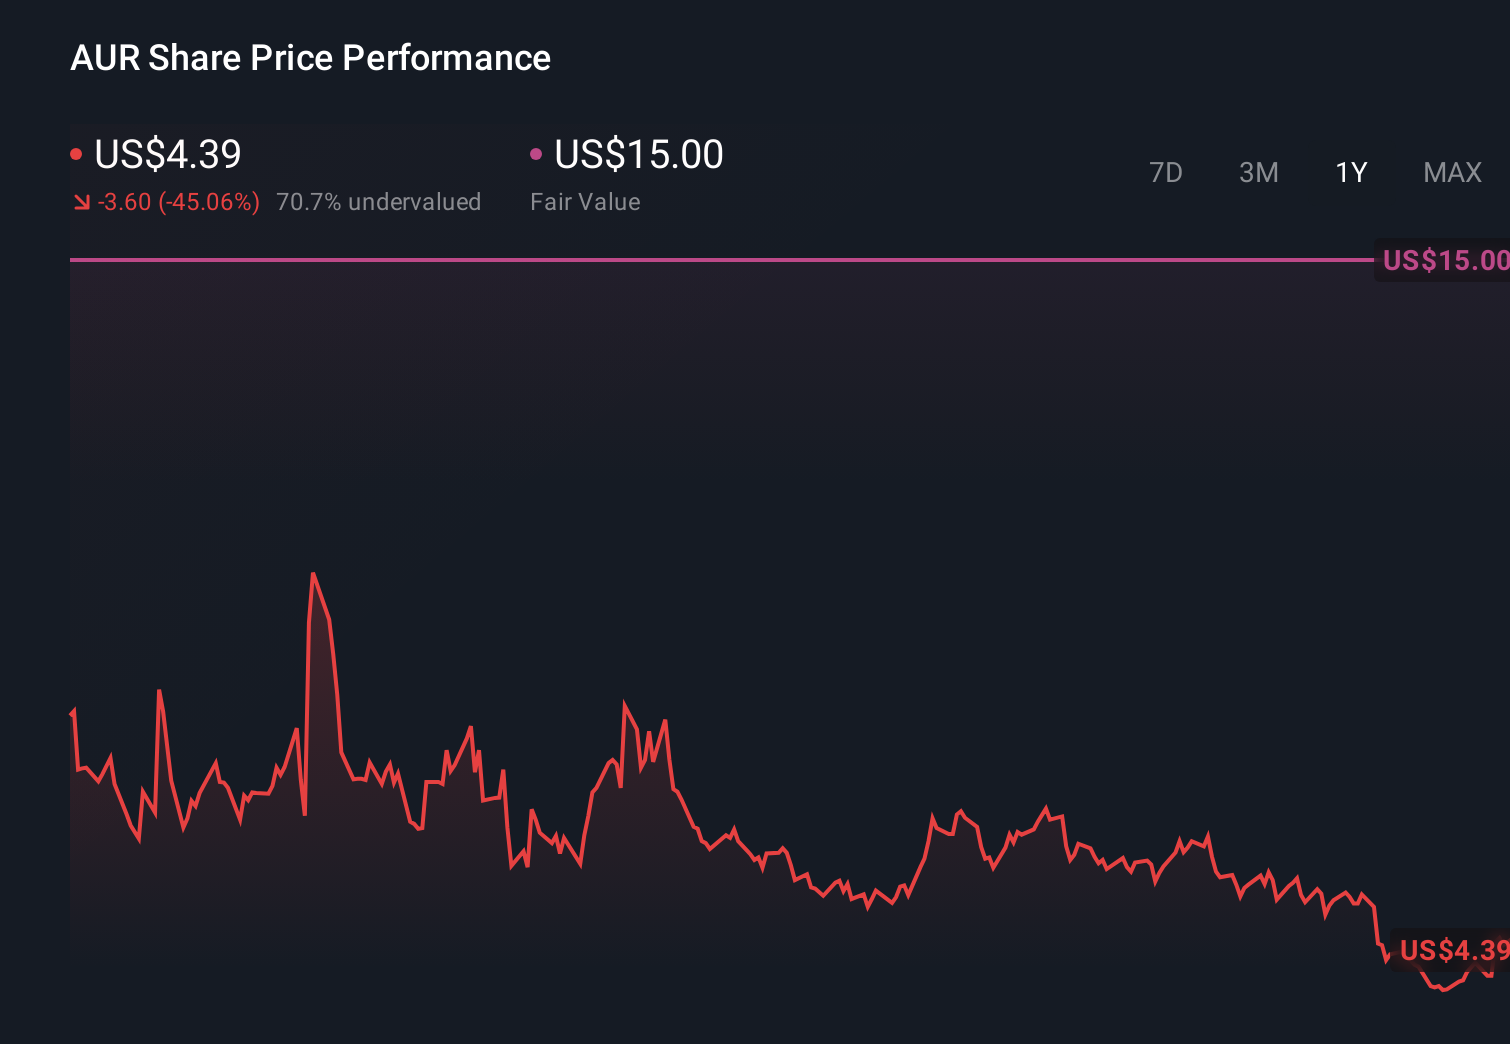
- The share price has slid about 0.2% over the last week and is still down 26.2% year to date, but the longer term 3 year gain of 265.9% shows how quickly sentiment can flip in either direction.
- Recently, investor attention has been driven more by the broader self driving and AI narrative than by company specific catalysts, with capital flowing back into high growth, higher risk names as rate cut hopes build. At the same time, renewed debate around regulation and timelines for commercial autonomy programs has reminded the market that this is still a high uncertainty story.
- On our checks, Aurora Innovation currently scores a 3/6 valuation score, which suggests there is some value support but not a screaming discount. Next, we will walk through the usual valuation approaches, before ending with a more nuanced way to think about what this stock is really worth.
Find out why Aurora Innovation's -38.9% return over the last year is lagging behind its peers.
Approach 1: Aurora Innovation Discounted Cash Flow (DCF) Analysis
A Discounted Cash Flow, or DCF, model estimates what a business is worth today by projecting its future cash flows and then discounting those back to a present value. For Aurora Innovation, the 2 Stage Free Cash Flow to Equity model starts from a last twelve month Free Cash Flow of about $614.5 Million outflow, reflecting the heavy investment phase typical of autonomous driving companies.
Analysts expect cash flows to remain negative for several years, with Simply Wall St extrapolating a gradual improvement that turns positive by 2029, when Free Cash Flow is projected to reach roughly $312.65 Million. By 2035, those projections rise toward around $1.21 Billion of annual Free Cash Flow, assuming strong scaling of commercial autonomy programs.
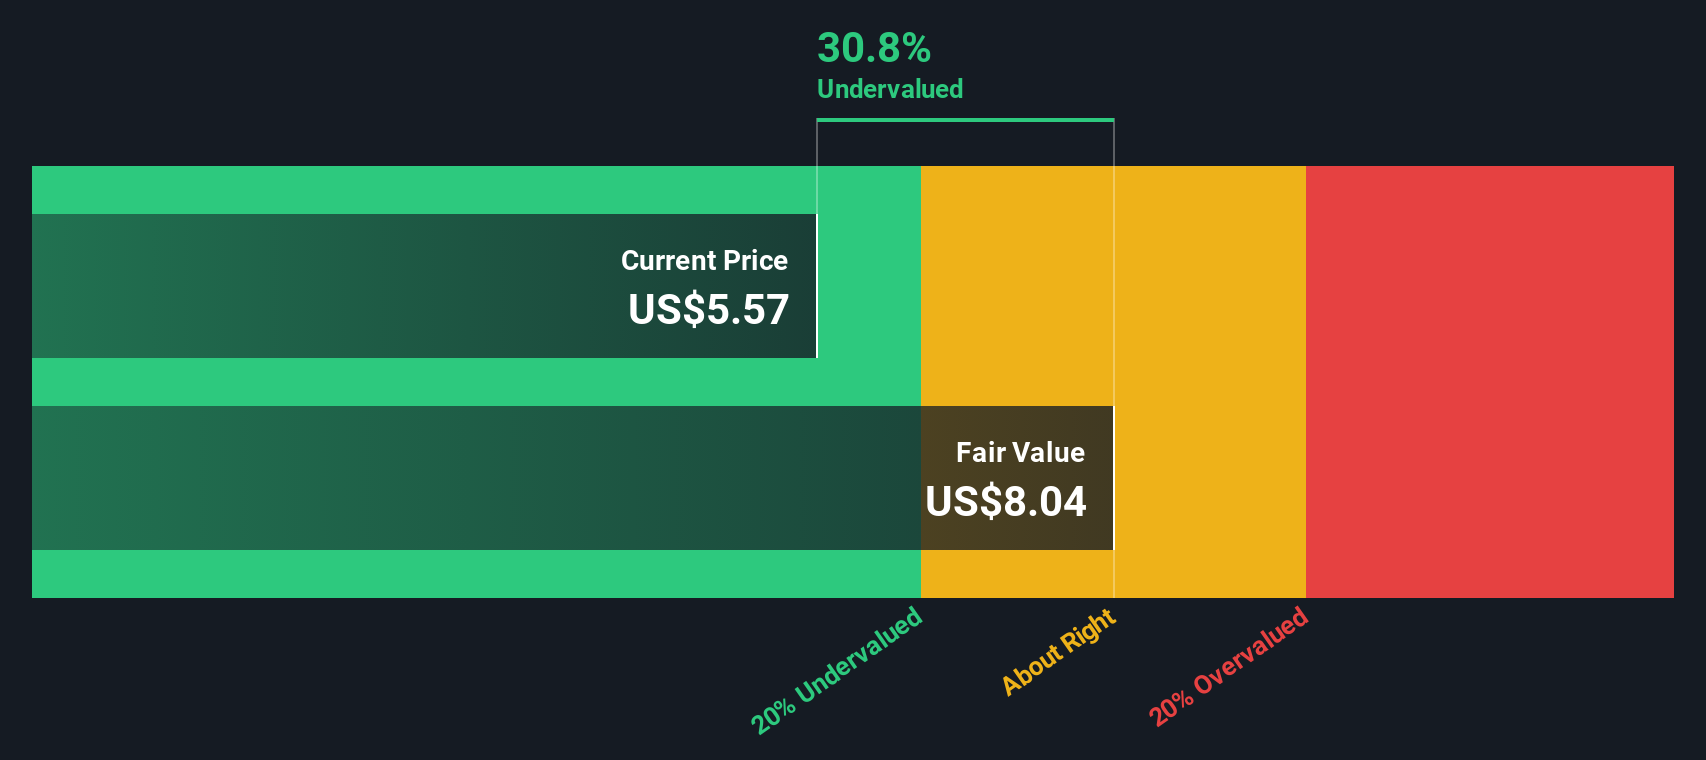
Bringing all those projected cash flows back to today, the model arrives at an intrinsic value of roughly $6.22 per share. This implies Aurora Innovation trades at a 27.6% discount to its estimated fair value at current prices near $4.50. On this view, investors are effectively being compensated for tolerating significant execution and regulatory risk.
Result: UNDERVALUED
Our Discounted Cash Flow (DCF) analysis suggests Aurora Innovation is undervalued by 27.6%. Track this in your watchlist or portfolio, or discover 907 more undervalued stocks based on cash flows.
Approach 2: Aurora Innovation Price vs Book
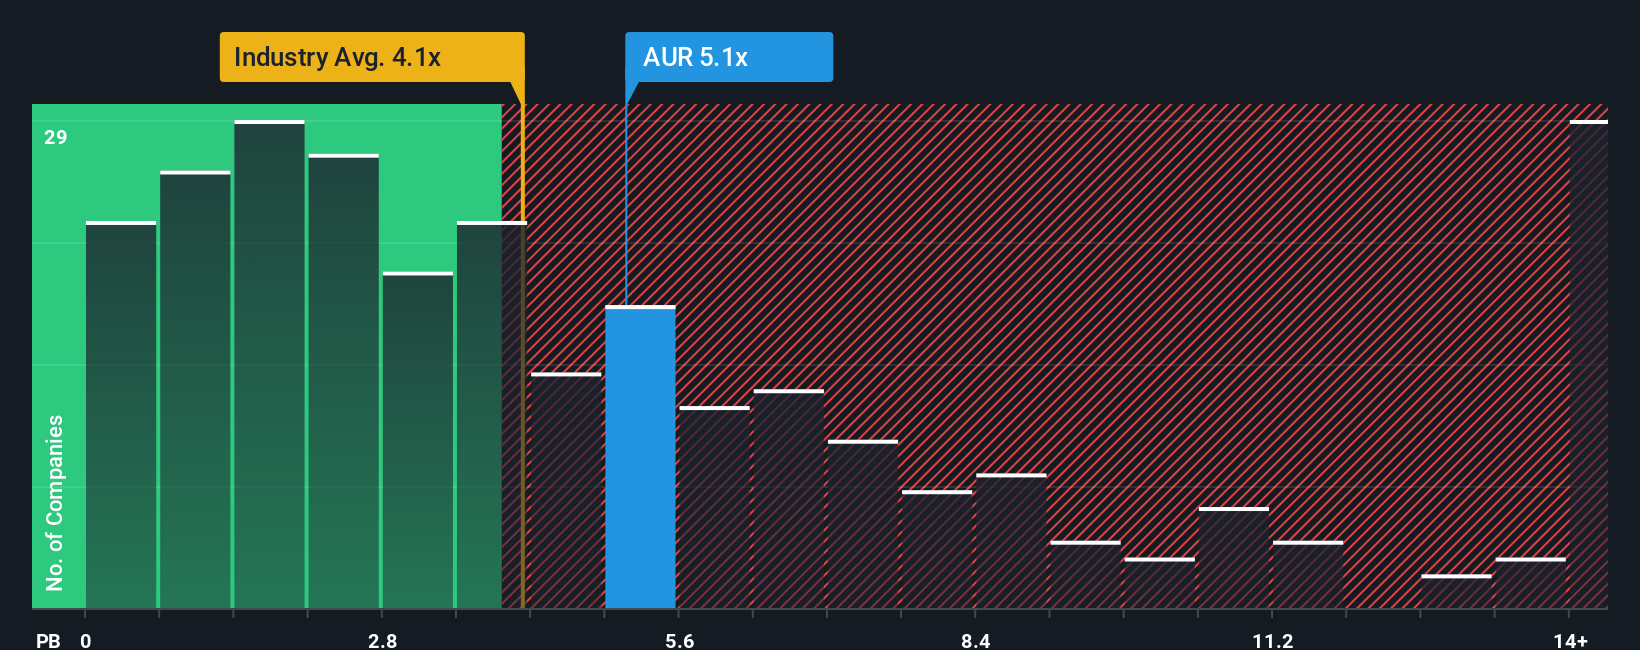
For companies that are still loss making or pre revenue, like many in autonomous driving, the price to book ratio is often a more useful yardstick than earnings based multiples. It anchors valuation to the equity investors have actually funded on the balance sheet. In general, faster growth and lower perceived risk justify investors paying a higher multiple of book value, while slower growth or higher uncertainty usually call for a lower, more conservative ratio.
Aurora Innovation currently trades at about 3.80x book value, which is slightly above the broader Software industry average of roughly 3.48x, but well below the 13.82x average for closer, high growth peers. Simply Wall St adds another layer with its Fair Ratio, a proprietary estimate of what a reasonable price to book multiple should be once factors like Aurora Innovation growth outlook, risk profile, profitability, industry positioning and market cap are all accounted for. This makes it more tailored than a simple comparison with peers or industry averages, which can be distorted by outliers or very different business models.
Because the Fair Ratio is currently not available, we cannot definitively say whether the current 3.80x signals overvaluation or undervaluation versus that benchmark.
Result: ABOUT RIGHT
PB ratios tell one story, but what if the real opportunity lies elsewhere? Discover 1446 companies where insiders are betting big on explosive growth.
Upgrade Your Decision Making: Choose your Aurora Innovation Narrative
Earlier we mentioned that there is an even better way to understand valuation, so let us introduce you to Narratives, a simple framework that lets you connect your view of a company’s future to the numbers behind it. A Narrative is your story about Aurora Innovation, where you spell out what you believe about its future revenue growth, profit margins and risks, and then link that story to a financial forecast and, ultimately, to a fair value estimate. Narratives are available on Simply Wall St’s Community page, where millions of investors use them as an easy, accessible tool to compare a stock’s Fair Value to its current Price and decide whether it looks like a buy, hold or sell. Because Narratives update dynamically as new information arrives, such as fresh earnings or major news, your valuation view can automatically evolve with the facts. For example, one investor’s Narrative might assume rapid adoption of Aurora’s self driving technology and assign a much higher fair value, while another more cautious Narrative might assume slower commercialization and a far lower fair value at the same share price.
Do you think there's more to the story for Aurora Innovation? Head over to our Community to see what others are saying!
This article by Simply Wall St is general in nature. We provide commentary based on historical data and analyst forecasts only using an unbiased methodology and our articles are not intended to be financial advice. It does not constitute a recommendation to buy or sell any stock, and does not take account of your objectives, or your financial situation. We aim to bring you long-term focused analysis driven by fundamental data. Note that our analysis may not factor in the latest price-sensitive company announcements or qualitative material. Simply Wall St has no position in any stocks mentioned.
Have feedback on this article? Concerned about the content? Get in touch with us directly. Alternatively, email editorial-team@simplywallst.com