
Has PayPal’s Long Slide Created a Value Opportunity in 2025?
- If you are wondering whether PayPal is a beaten down tech name or a quiet value opportunity waiting to be noticed, you are in the right place to unpack what the current price is really offering.
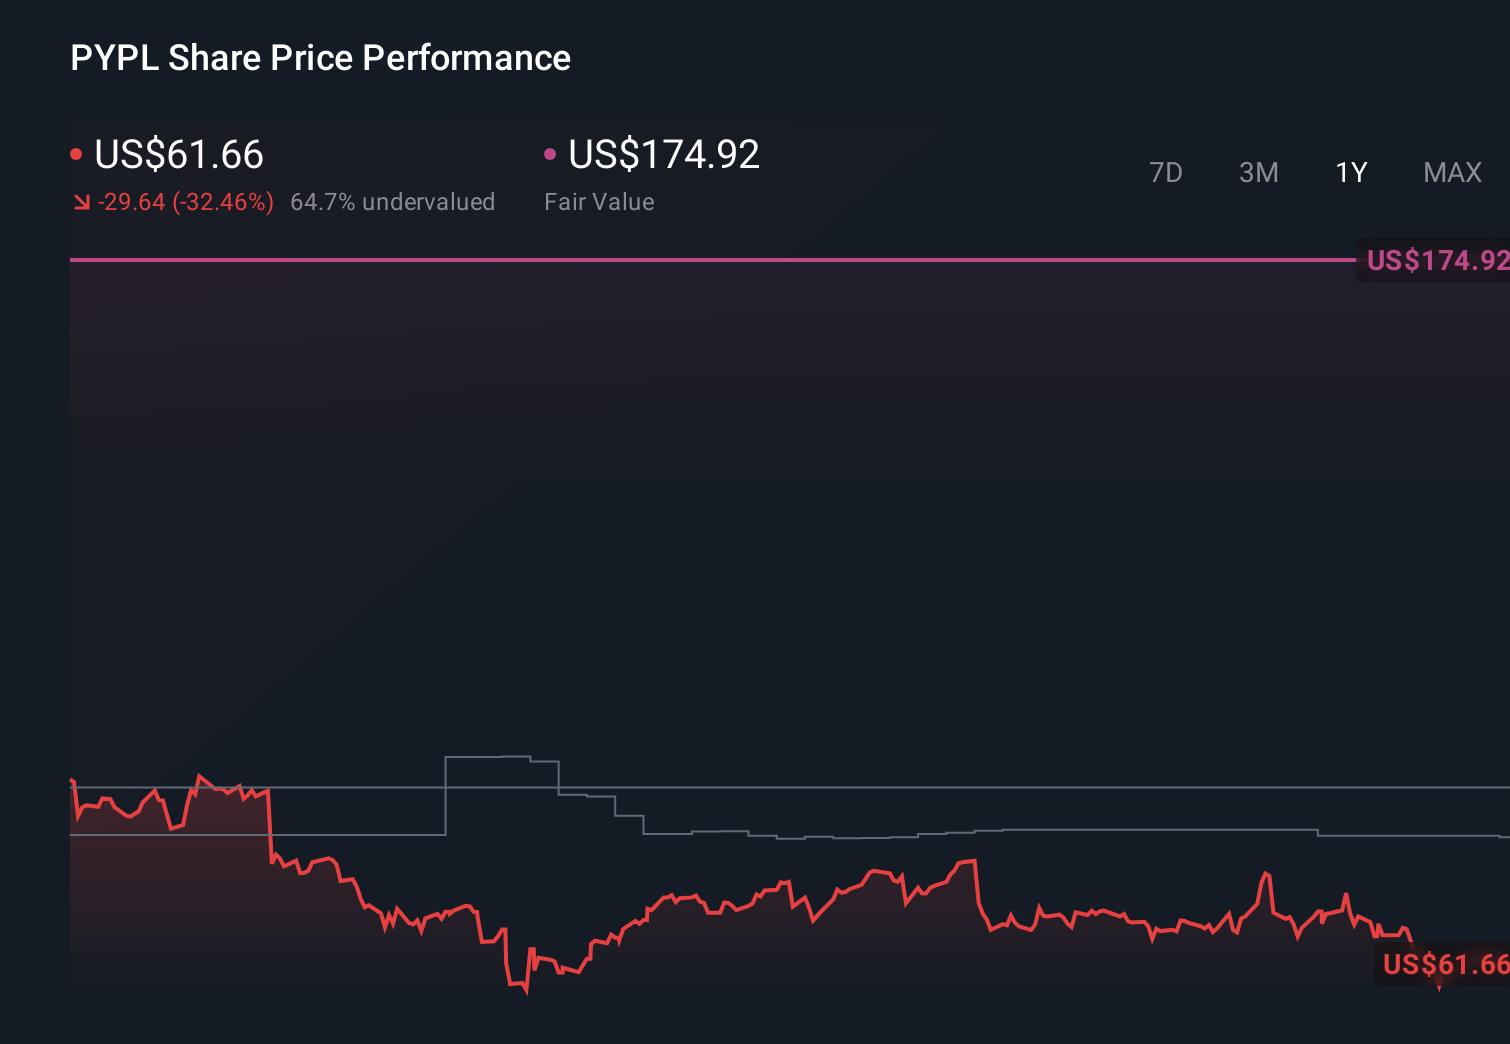
- Despite a long term slide, with the share price down 74.0% over 5 years and 31.4% over the last year, recent moves have been a little less dramatic, with the stock roughly flat over 7 days and down 9.3% over the last month.
- Investors have been watching closely as PayPal pushes deeper into branded checkout, launches features like passkeys to streamline logins, and rolls out enhancements to its small business payments tools, all aimed at defending and growing its core franchise. At the same time, headlines about intensifying competition from Apple, Stripe and traditional card networks have kept a spotlight on whether PayPal can turn product momentum into sustained market share gains.
- Right now, PayPal scores a solid 5/6 on our valuation checks, suggesting it screens as undervalued on most of the metrics we track. Next we will walk through those valuation approaches in detail and then circle back to a more complete way of thinking about what the stock is truly worth.
Find out why PayPal Holdings's -31.4% return over the last year is lagging behind its peers.
Approach 1: PayPal Holdings Excess Returns Analysis
The Excess Returns model looks at how much profit a company can generate over and above the return that shareholders require, then capitalizes those surplus profits into an intrinsic value per share. Instead of focusing on near term earnings alone, it emphasizes the quality and productivity of equity capital over time.
For PayPal, the analysis starts with a Book Value of $21.46 per share and a Stable EPS estimate of $6.23 per share, based on weighted future return on equity forecasts from 10 analysts. With an Average Return on Equity of 24.49% and a Cost of Equity of $1.97 per share, the company is estimated to generate an Excess Return of $4.25 per share on a Stable Book Value that grows to $25.42 per share, informed by forecasts from 8 analysts.
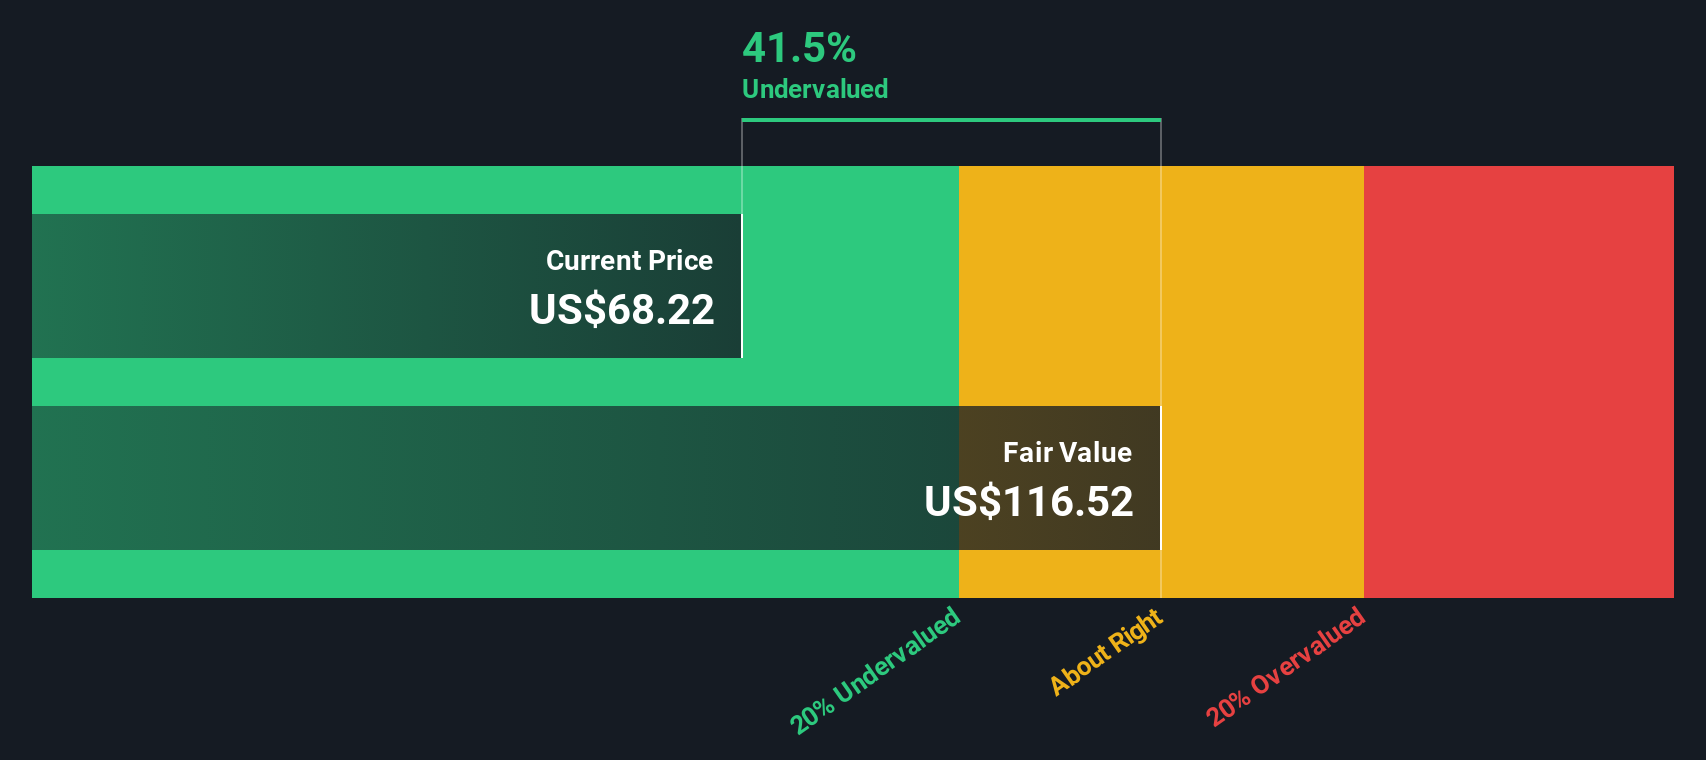
When these excess returns are projected and discounted, the model arrives at an intrinsic value of about $120.16 per share, implying that the stock is roughly 49.1% undervalued versus its current market price. In other words, the market does not appear to be fully pricing in PayPal’s long term return profile.
Result: UNDERVALUED
Our Excess Returns analysis suggests PayPal Holdings is undervalued by 49.1%. Track this in your watchlist or portfolio, or discover 907 more undervalued stocks based on cash flows.
Approach 2: PayPal Holdings Price vs Earnings
For a mature, profitable business like PayPal, the price to earnings, or PE, ratio is a useful way to judge whether investors are paying a reasonable price for each dollar of current profits. In broad terms, companies with stronger and more reliable earnings growth, and lower perceived risk, tend to justify a higher, or more expensive, PE multiple, while slower growth or higher uncertainty should command a lower multiple.
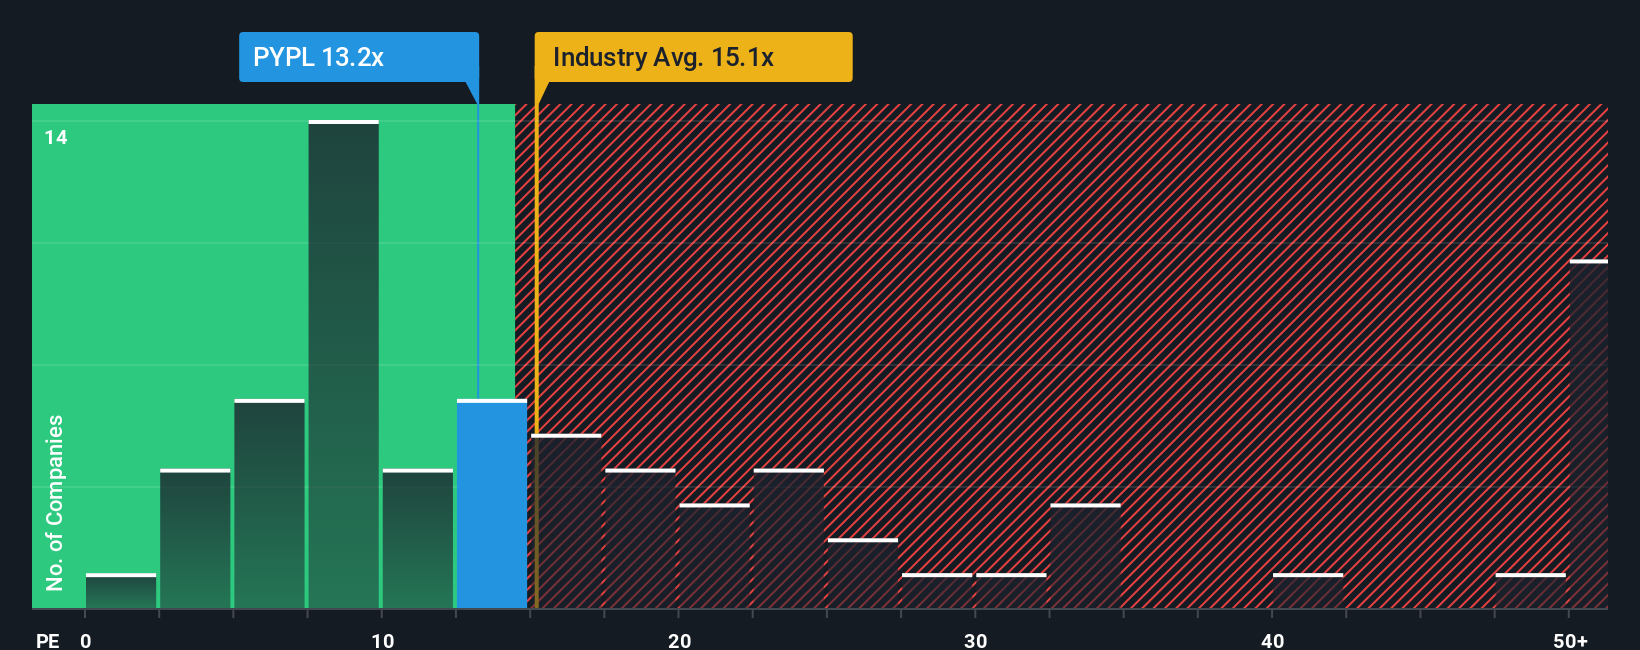
PayPal currently trades on a PE of about 11.64x, which is below the Diversified Financial industry average of roughly 13.56x and far below the peer group average of around 59.45x. To move beyond blunt comparisons, Simply Wall St calculates a proprietary Fair Ratio for the stock, which indicates what PE multiple might be appropriate once factors such as PayPal’s specific earnings growth profile, profitability, industry context, market capitalization and risk characteristics are taken into account.
On this basis, PayPal’s Fair Ratio is estimated at 17.95x, which is meaningfully higher than its current 11.64x multiple. That suggests the market is pricing PayPal at a discount to what its fundamentals and risk profile would typically warrant, indicating potential upside if sentiment normalizes.
Result: UNDERVALUED
PE ratios tell one story, but what if the real opportunity lies elsewhere? Discover 1446 companies where insiders are betting big on explosive growth.
Upgrade Your Decision Making: Choose your PayPal Holdings Narrative
Earlier we mentioned that there is an even better way to understand valuation, so let us introduce you to Narratives.
A Narrative is simply your story about a company, tied to the numbers you think make sense, like your fair value, and your expectations for future revenue, earnings and margins.
On Simply Wall St, Narratives sit in the Community page and help you connect the dots from business story to financial forecast to a fair value you can compare against today’s share price to decide whether PayPal looks like a buy, a hold or a sell.
Because Narratives on the platform update dynamically when new information arrives, such as earnings, product launches or news about competition, your view of PayPal never has to be static or out of date.
For example, one PayPal Narrative might focus on Venmo monetization, PayPal World and AI commerce partnerships and land at a fair value around $133, while a more cautious Narrative that leans on slower growth, competitive pressure and legal risks might sit closer to $62. Seeing where your own view fits between those extremes can clarify what you should do next.
Do you think there's more to the story for PayPal Holdings? Head over to our Community to see what others are saying!
This article by Simply Wall St is general in nature. We provide commentary based on historical data and analyst forecasts only using an unbiased methodology and our articles are not intended to be financial advice. It does not constitute a recommendation to buy or sell any stock, and does not take account of your objectives, or your financial situation. We aim to bring you long-term focused analysis driven by fundamental data. Note that our analysis may not factor in the latest price-sensitive company announcements or qualitative material. Simply Wall St has no position in any stocks mentioned.
Have feedback on this article? Concerned about the content? Get in touch with us directly. Alternatively, email editorial-team@simplywallst.com