
Assessing Sanofi’s Valuation After Share Price Drop and Strategic Shift into Specialty Medicines
- Wondering if Sanofi is quietly turning into a bargain while the market is distracted? Let us unpack what the recent share price action really means for long term value focused investors.
- Despite a solid 29.7% gain over 5 years, the stock is down 12.3% year to date, with shorter term moves also in the red at 4.8% over 30 days and 3.5% over the last week, reminding investors that sentiment can shift faster than fundamentals.
- Recent headlines have centered on Sanofi’s strategic push deeper into specialty medicines and vaccines, alongside portfolio simplification moves such as asset divestments and targeted R and D partnerships. Together, these updates have nudged the market to reassess both the company’s growth runway and the risks baked into the current price.
- Even after that volatility, Sanofi scores a strong 6/6 on our valuation checks. This suggests the stock screens as undervalued across every metric we use today. We will walk through those methods next, and we will also flag a smarter way to think about valuation at the end of this article.
Find out why Sanofi's -5.4% return over the last year is lagging behind its peers.
Approach 1: Sanofi Discounted Cash Flow (DCF) Analysis
A Discounted Cash Flow model projects the cash a company is expected to generate in the future, and then discounts those cash flows back into today’s money to estimate what the business is worth now.
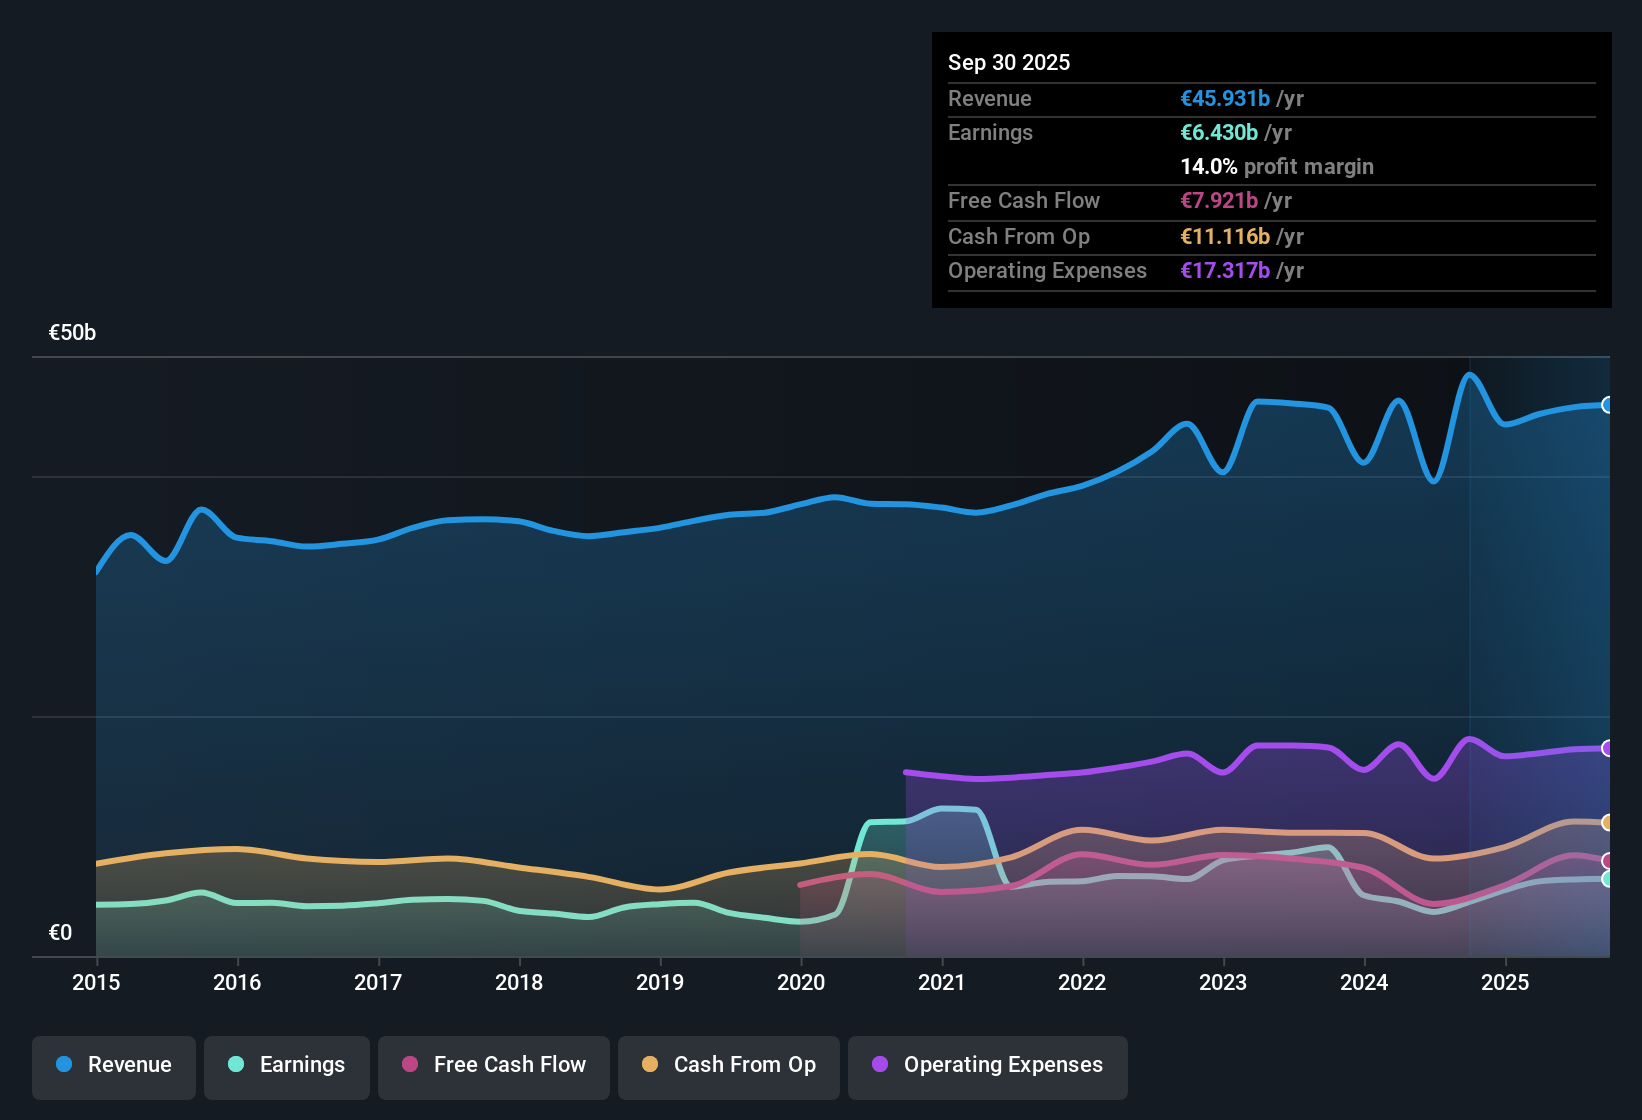
For Sanofi, the latest twelve month free cash flow stands at about €8.1 billion. Analyst forecasts and Simply Wall St’s extrapolations anticipate this rising steadily, with free cash flow projected to reach roughly €17.6 billion by 2035. Over the next decade, the combination of analyst estimates and modeled growth translates into a series of growing annual cash flows that form the basis of the 2 Stage Free Cash Flow to Equity valuation.
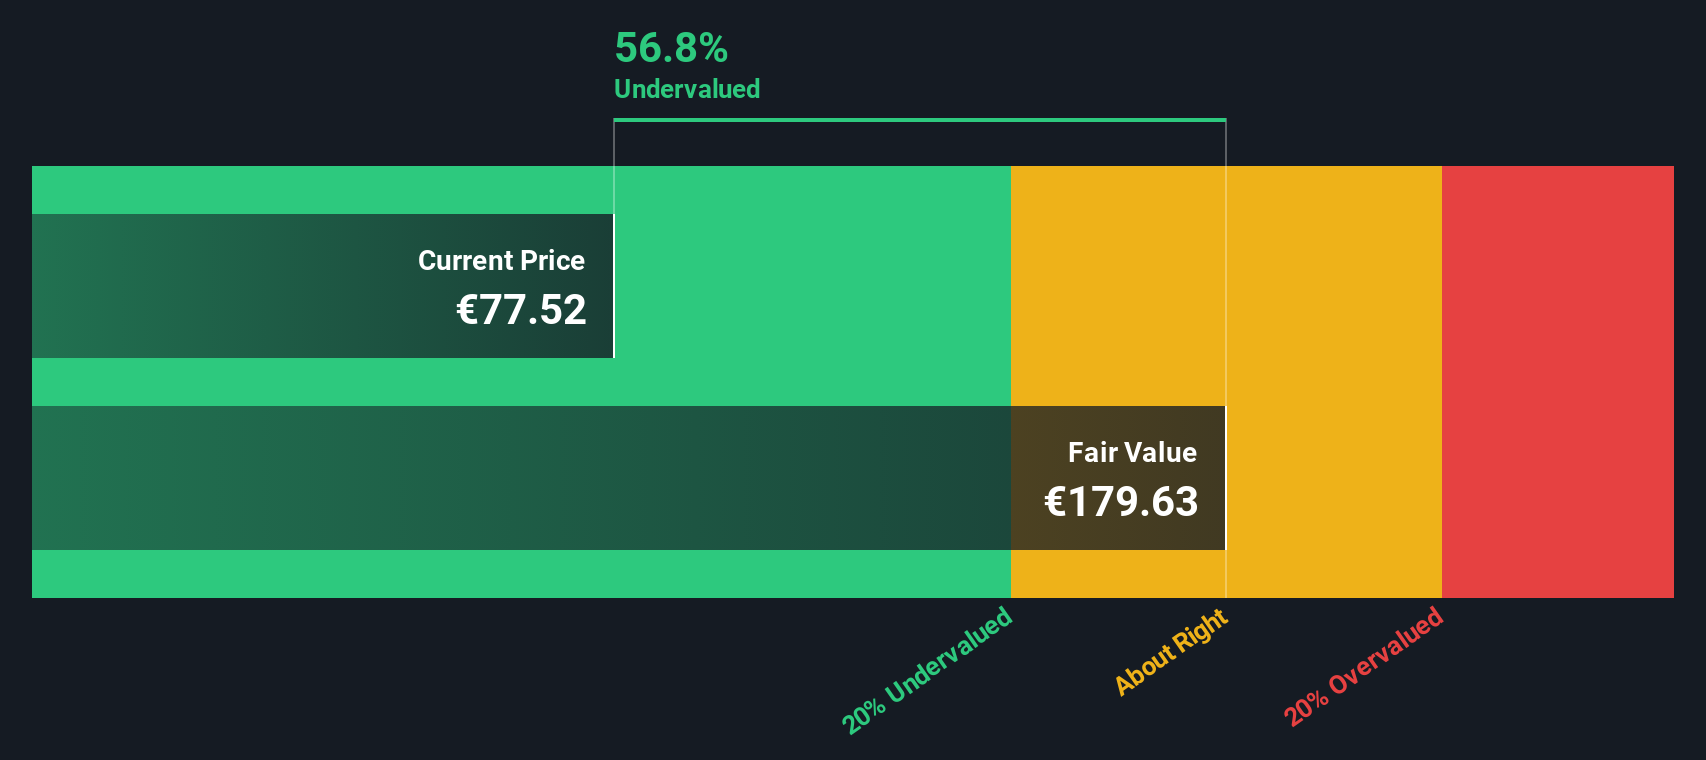
When these projected cash flows are discounted back to today, the model suggests an intrinsic value of about €279.61 per share. Compared with the current share price, this implies Sanofi is trading at roughly a 70.4% discount to its estimated fair value, which indicates a wide margin of safety for long term investors who rely on this cash flow outlook.
Result: UNDERVALUED
Our Discounted Cash Flow (DCF) analysis suggests Sanofi is undervalued by 70.4%. Track this in your watchlist or portfolio, or discover 907 more undervalued stocks based on cash flows.
Approach 2: Sanofi Price vs Earnings
For established, profitable companies like Sanofi, the price to earnings ratio is a practical way to gauge how much investors are paying for each euro of current profits. It links market value directly to earnings today, which makes it intuitive and widely used across the Pharmaceuticals industry.
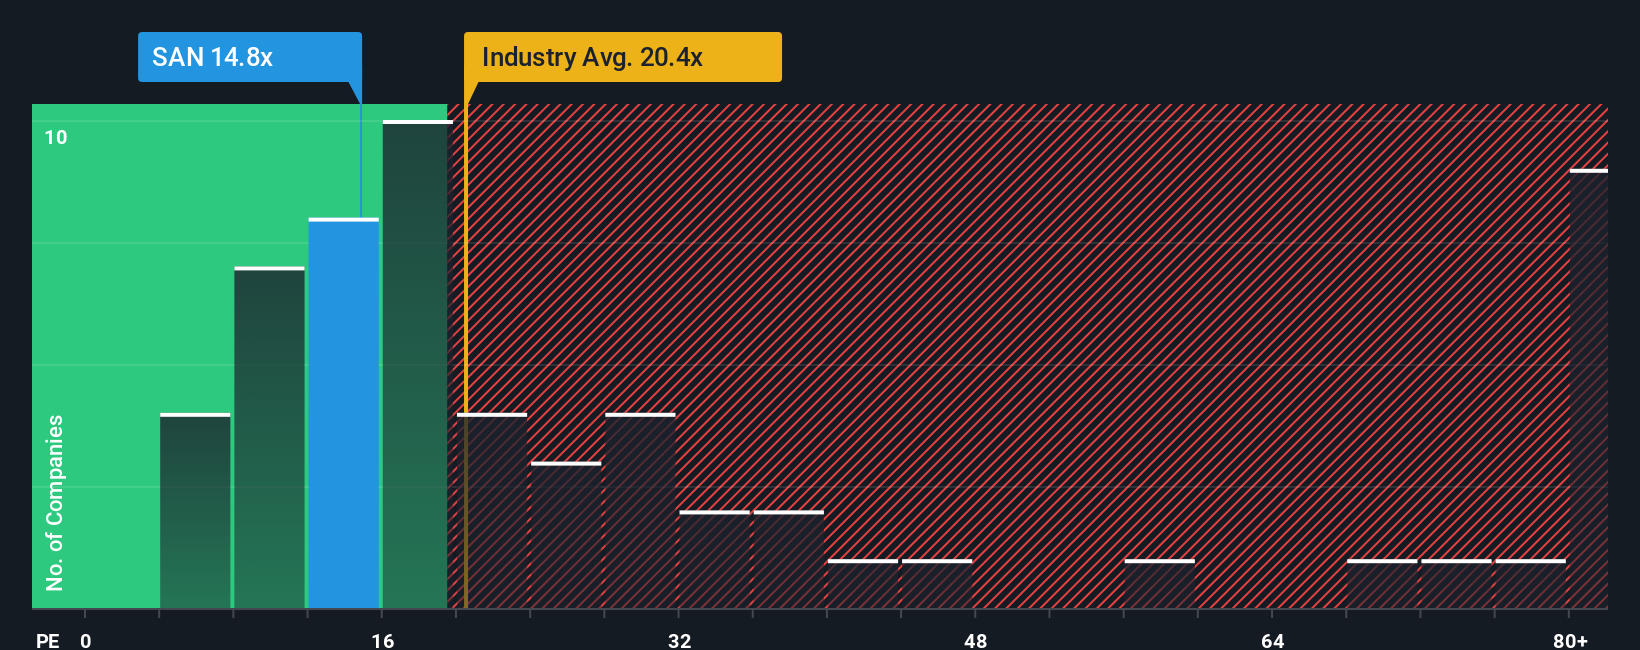
What counts as a normal PE depends on how fast earnings are expected to grow and how risky those earnings are. Higher growth and lower perceived risk usually justify a higher multiple, while slower growth or higher uncertainty tend to compress it. Sanofi currently trades on a PE of about 15.6x, which is meaningfully below the broader Pharmaceuticals industry average of around 22.5x and also below the peer group average of roughly 21.4x.
Simply Wall St’s Fair Ratio framework goes a step further by estimating what PE Sanofi should trade on, given its earnings growth profile, margins, industry, market cap and risk factors. For Sanofi, this Fair Ratio is about 23.5x, which is comfortably above the current 15.6x market multiple. That gap suggests the market is pricing Sanofi more cautiously than its fundamentals warrant, and this points to upside potential if sentiment normalizes.
Result: UNDERVALUED
PE ratios tell one story, but what if the real opportunity lies elsewhere? Discover 1446 companies where insiders are betting big on explosive growth.
Upgrade Your Decision Making: Choose your Sanofi Narrative
Earlier we mentioned that there is an even better way to understand valuation, so let us introduce you to Narratives, an easy tool on Simply Wall St’s Community page that lets you attach a clear story to your numbers by setting your own assumptions for Sanofi’s future revenue, earnings, margins and fair value. A Narrative links what you believe about the business, for example that Sanofi’s pipeline, biologics leadership and vaccine portfolio will unlock long term growth, or that pricing pressure and patent expiries will cap returns, to a financial forecast and then to a fair value estimate. As fresh data comes in from news, earnings or regulatory updates, the Narrative automatically refreshes so you can quickly compare its evolving fair value to today’s share price and decide whether Sanofi looks like a buy, hold or sell to you, even if other investors are simultaneously running more bullish or more cautious Sanofi Narratives based on the same information but with different growth, margin or risk expectations.
Do you think there's more to the story for Sanofi? Head over to our Community to see what others are saying!
This article by Simply Wall St is general in nature. We provide commentary based on historical data and analyst forecasts only using an unbiased methodology and our articles are not intended to be financial advice. It does not constitute a recommendation to buy or sell any stock, and does not take account of your objectives, or your financial situation. We aim to bring you long-term focused analysis driven by fundamental data. Note that our analysis may not factor in the latest price-sensitive company announcements or qualitative material. Simply Wall St has no position in any stocks mentioned.
Have feedback on this article? Concerned about the content? Get in touch with us directly. Alternatively, email editorial-team@simplywallst.com