
Is Cardinal Health Still Attractively Priced After Its Huge 2025 Run And DCF Upside?
- If you are wondering whether Cardinal Health is still a smart buy after its massive run, or if you are arriving late to the party, this breakdown will help you think through whether the current price makes long term sense.
- The stock has cooled slightly in the short term, slipping around 0.8% over the last week and 3.5% over the last month, but it is still up roughly 67.9% year to date and about 71.2% over the last year, capping a 315.0% gain over five years.
- Recent headlines have focused on Cardinal Health's expanding role in pharmaceutical distribution and strategic partnerships in healthcare services. This reinforces the idea that it is becoming an increasingly critical player in the drug supply chain. At the same time, ongoing discussion around regulatory scrutiny and industry consolidation has kept investors debating how durable these gains really are.
- Despite that backdrop, Cardinal Health currently scores just 2/6 on our valuation checks, which means only a couple of metrics flag it as undervalued. In what follows, we will dig into DCF, multiples, and other lenses, then finish by looking at a more nuanced way to judge whether the stock is truly priced for its future.
Cardinal Health scores just 2/6 on our valuation checks. See what other red flags we found in the full valuation breakdown.
Approach 1: Cardinal Health Discounted Cash Flow (DCF) Analysis
A Discounted Cash Flow model estimates what a company is worth by projecting the cash it can generate in the future and then discounting those cash flows back to today in dollar terms.
For Cardinal Health, the latest twelve months Free Cash Flow is about $4.46 billion, and analysts expect this to gradually rise as the business scales. Simply Wall St uses a 2 Stage Free Cash Flow to Equity model that combines analyst estimates for the next few years with extrapolated forecasts beyond that, reaching projected Free Cash Flow of roughly $5.62 billion by 2035.
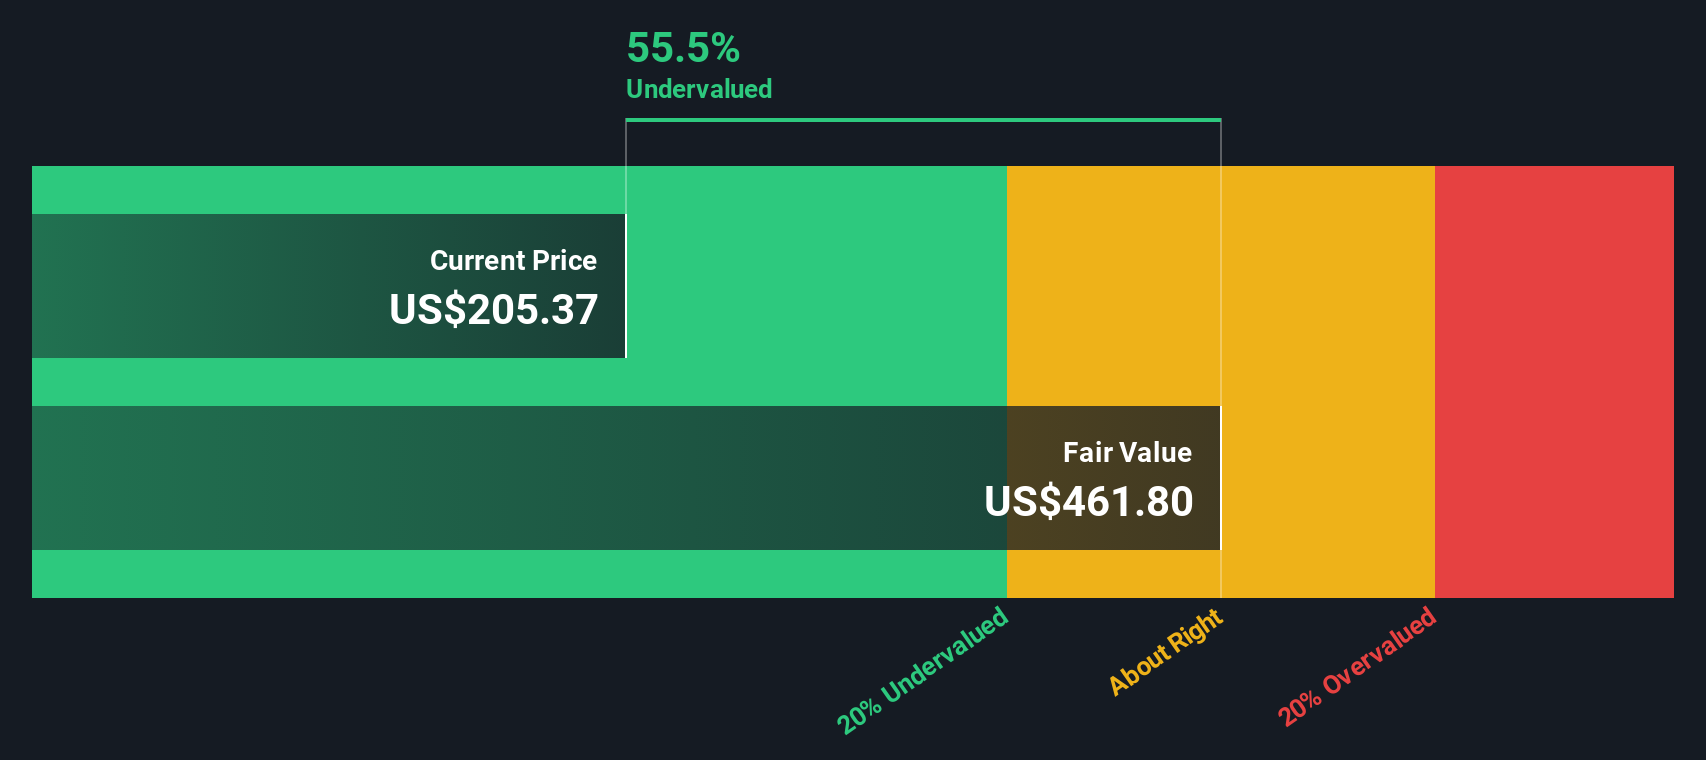
When all those future cash flows are discounted back, the model arrives at an intrinsic value of about $461.54 per share. Compared with the current market price, this implies the shares are trading at roughly a 57.1% discount to their estimated fair value, indicating that the market is still pricing Cardinal Health cautiously despite strong cash generation.
Result: UNDERVALUED
Our Discounted Cash Flow (DCF) analysis suggests Cardinal Health is undervalued by 57.1%. Track this in your watchlist or portfolio, or discover 907 more undervalued stocks based on cash flows.
Approach 2: Cardinal Health Price vs Earnings
For profitable businesses like Cardinal Health, the Price to Earnings (PE) ratio is a practical way to judge valuation because it links what investors pay directly to the company’s bottom line. In general, companies with stronger, more reliable growth and lower perceived risk deserve a higher PE multiple, while slower growth or greater uncertainty tends to pull a fair PE down.
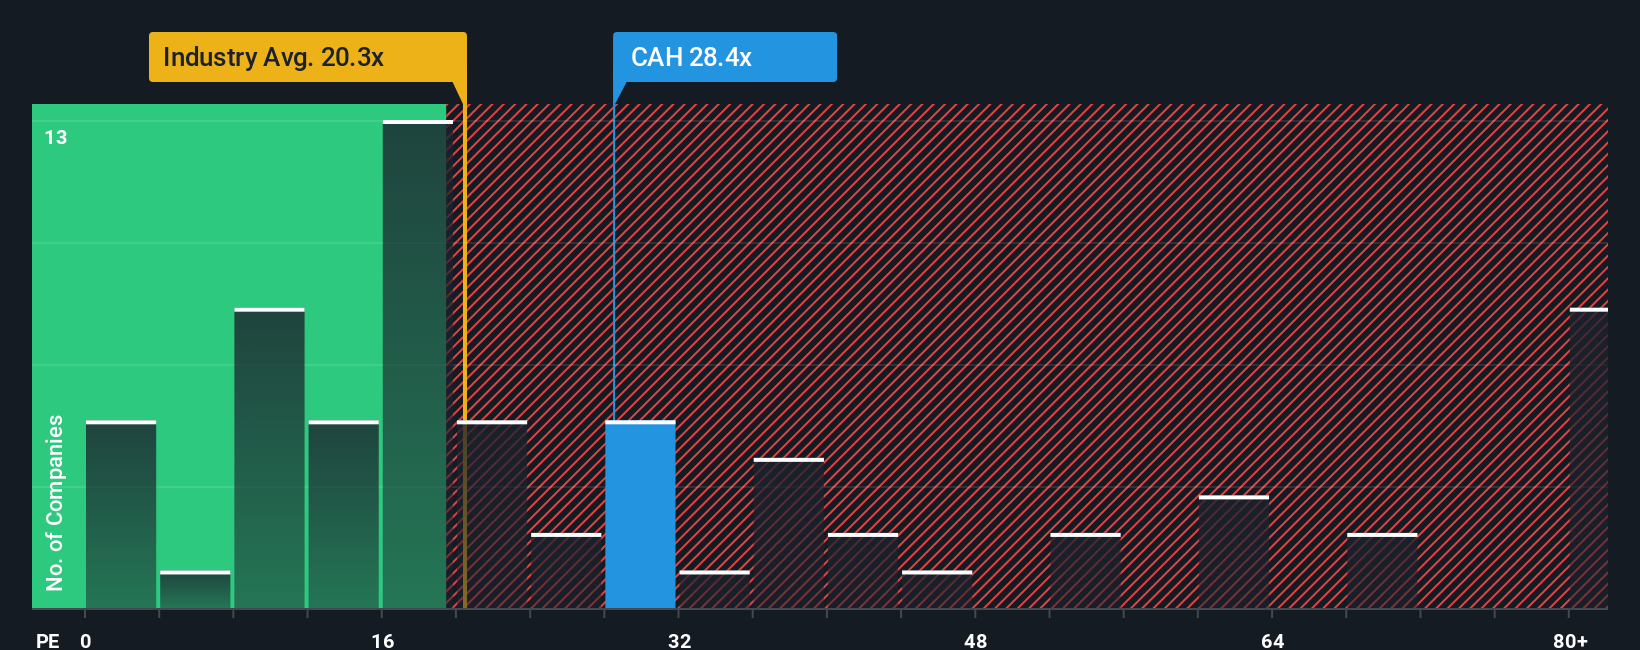
Cardinal Health currently trades on a PE of about 29.5x. This sits above the broader Healthcare industry average of roughly 23.3x, but only modestly higher than its peer group at around 27.1x. Simply Wall St also estimates a proprietary “Fair Ratio” of 29.1x for Cardinal Health, based on its earnings growth prospects, profitability, industry, market cap, and specific risk profile. This Fair Ratio is more informative than a simple peer or industry comparison because it adjusts for the company’s own quality, growth runway, and risk characteristics, rather than assuming all healthcare distributors should command the same multiple.
With the actual PE of 29.5x sitting very close to the Fair Ratio of 29.1x, the stock looks broadly in line with what its fundamentals justify at today’s earnings level.
Result: ABOUT RIGHT
PE ratios tell one story, but what if the real opportunity lies elsewhere? Discover 1446 companies where insiders are betting big on explosive growth.
Upgrade Your Decision Making: Choose your Cardinal Health Narrative
Earlier we mentioned that there is an even better way to understand valuation, so let us introduce you to Narratives, a simple way to attach a clear story to your numbers by spelling out what you believe about a company’s future revenue, earnings and margins, then linking that story to a financial forecast and, ultimately, to a fair value estimate that you can easily compare with today’s share price to decide whether to buy, hold, or sell. Narratives on Simply Wall St, available in the Community page and used by millions of investors, are dynamic, so when new information like earnings or major news hits, the forecasts and fair values are refreshed automatically, helping your thesis stay current without you rebuilding spreadsheets. For Cardinal Health, one investor might build a bullish Narrative that leans into aging population demand, automation and specialty expansion to justify a fair value well above the current price, while a more cautious investor might focus on regulatory pressure and margin risk to arrive at a much lower fair value, and those differing perspectives are surfaced side by side so you can see where you stand.
Do you think there's more to the story for Cardinal Health? Head over to our Community to see what others are saying!

This article by Simply Wall St is general in nature. We provide commentary based on historical data and analyst forecasts only using an unbiased methodology and our articles are not intended to be financial advice. It does not constitute a recommendation to buy or sell any stock, and does not take account of your objectives, or your financial situation. We aim to bring you long-term focused analysis driven by fundamental data. Note that our analysis may not factor in the latest price-sensitive company announcements or qualitative material. Simply Wall St has no position in any stocks mentioned.
Have feedback on this article? Concerned about the content? Get in touch with us directly. Alternatively, email editorial-team@simplywallst.com