
Is CME Group Still Attractive After Its Strong Multi Year Share Price Rally?
- If you have been wondering whether CME Group is still worth buying after this long run up, you are not alone. This article is going to unpack what the current price really implies.
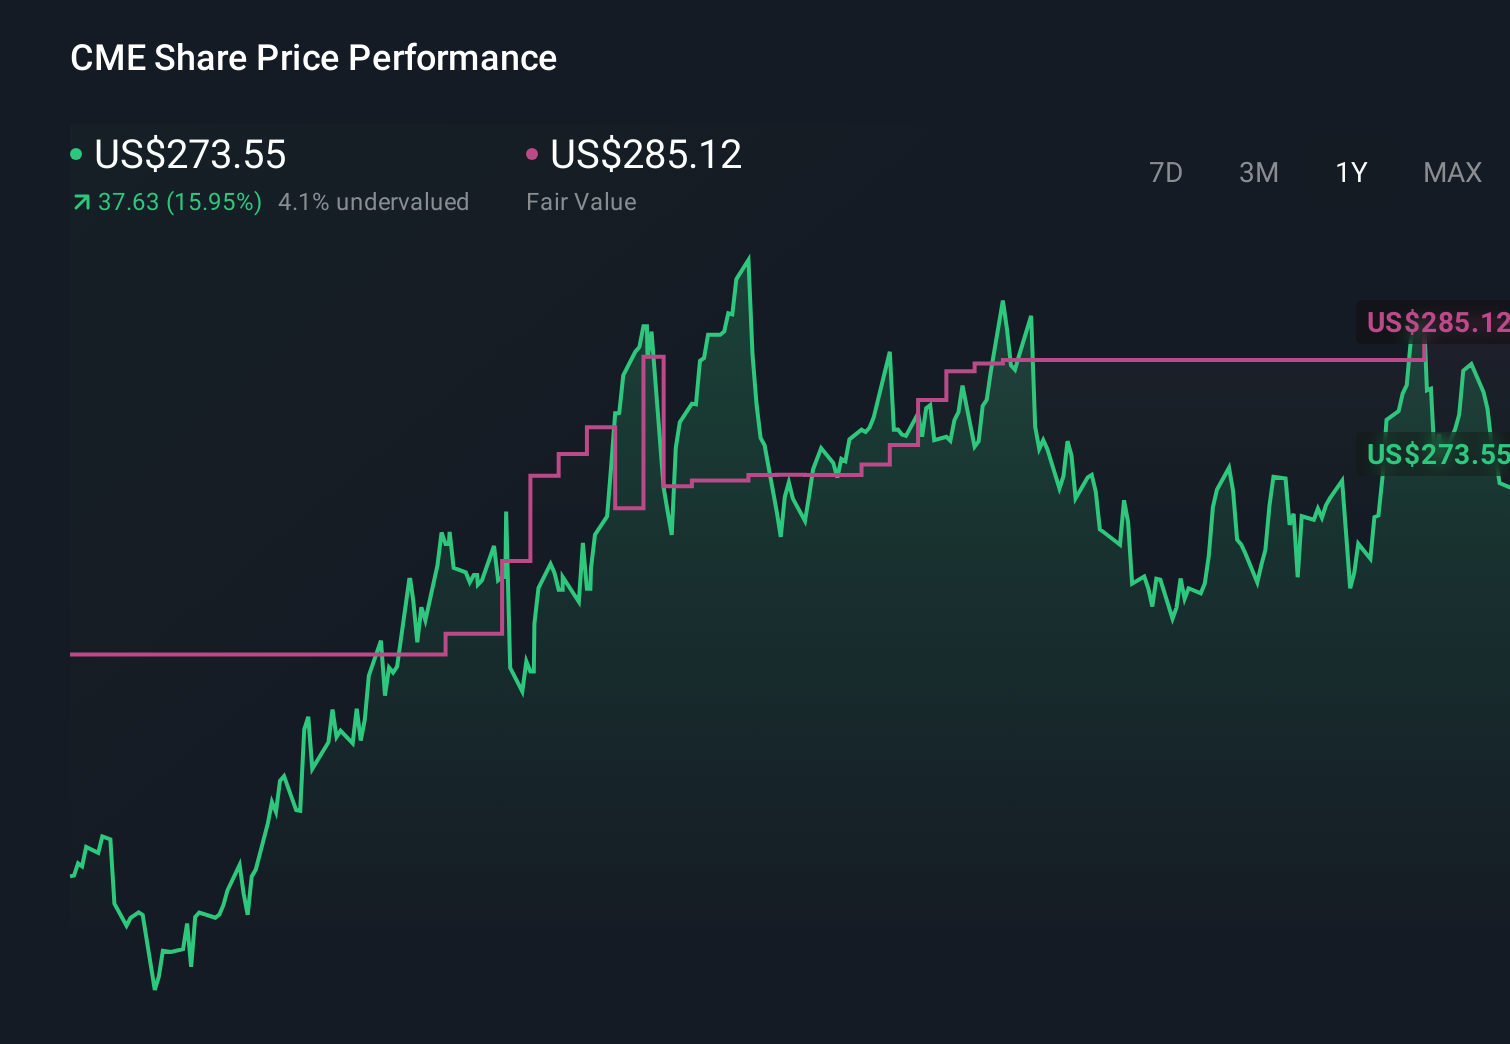
- Even after a recent pullback of around 2.9% over the last week and 3.9% over the last month, the stock is still up 14.4% year to date and about 18.2% over the past year, building on a powerful 74.0% three year and 78.8% five year climb.
- Those moves have come as CME continues to sit at the center of global derivatives trading, with investors paying close attention to volumes in key contracts like interest rate and equity index futures. Alongside that, the market is digesting how structural trends such as higher rate volatility, demand for risk management, and ongoing product innovation might support CME's long term growth trajectory.
- Despite this strong history, CME Group currently scores just 1/6 on our valuation checks. This means most of our traditional metrics suggest it is not obviously cheap. Next, we will walk through the main valuation methods investors typically lean on and then finish with a more holistic way to think about what the market is really pricing in.
CME Group scores just 1/6 on our valuation checks. See what other red flags we found in the full valuation breakdown.
Approach 1: CME Group Excess Returns Analysis
The Excess Returns model looks at how much profit a company can generate above the minimum return that shareholders require, and then projects how long those value creating returns can persist.
For CME Group, the model starts with a Book Value of $78.34 per share and a Stable EPS of $12.37 per share, based on weighted future Return on Equity estimates from 6 analysts. With an Average Return on Equity of 15.40%, the business is expected to earn meaningfully more than its Cost of Equity, which is estimated at $6.60 per share.
The difference between what CME is expected to earn and what shareholders require is the Excess Return, calculated at $5.77 per share. That excess is then capitalized over time using a Stable Book Value of $80.31 per share, which is drawn from weighted future Book Value estimates from 4 analysts, to arrive at an intrinsic value under the Excess Returns framework.
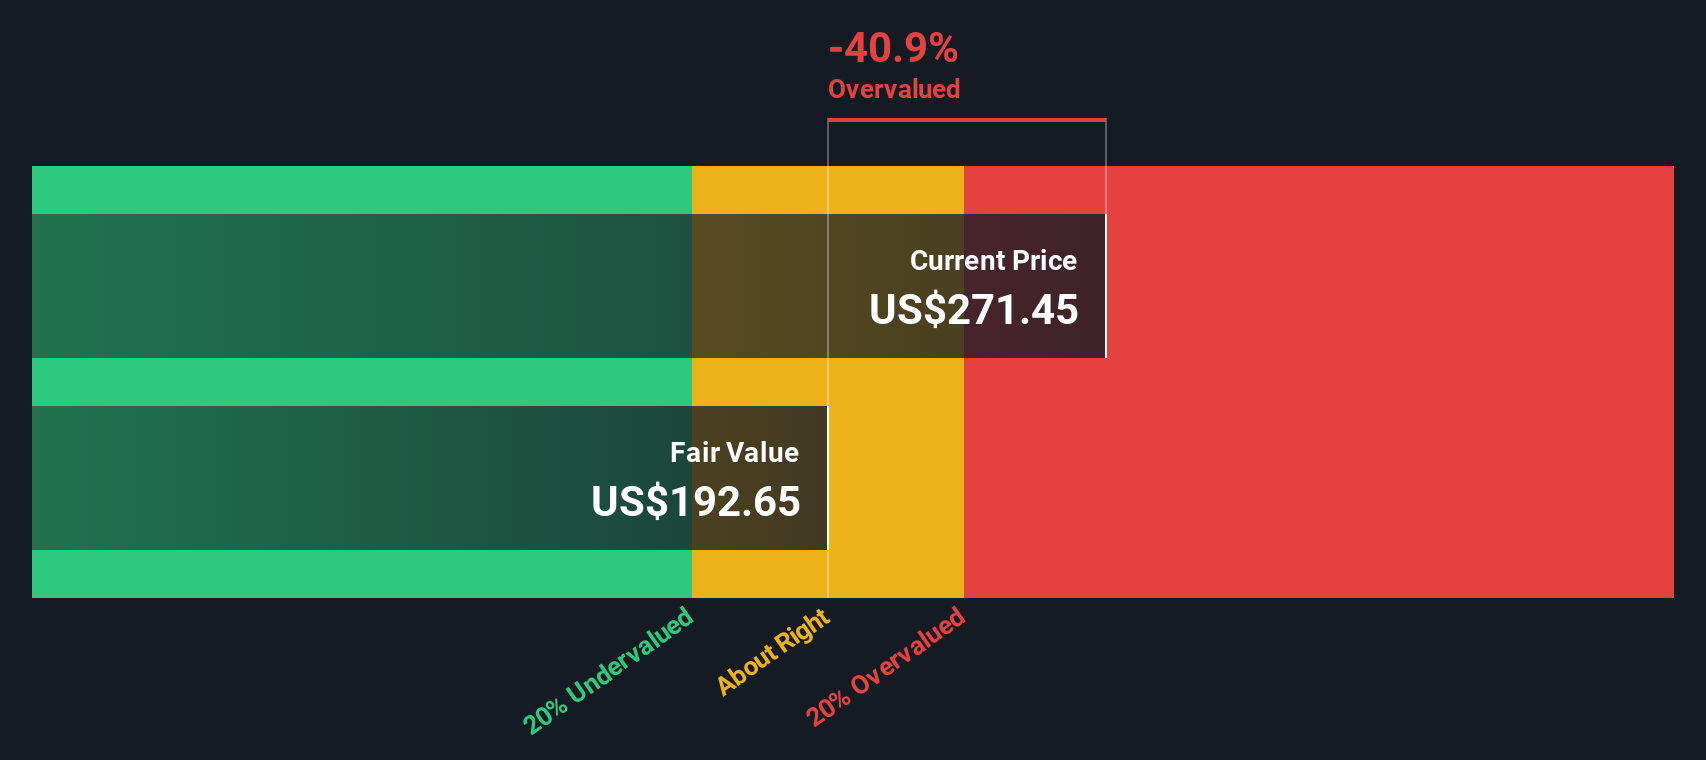
On this basis, the model implies CME Group is about 35.5% overvalued relative to the current share price, so the stock screens as expensive rather than cheap.
Result: OVERVALUED
Our Excess Returns analysis suggests CME Group may be overvalued by 35.5%. Discover 907 undervalued stocks or create your own screener to find better value opportunities.
Approach 2: CME Group Price vs Earnings
For a mature, consistently profitable business like CME Group, the price to earnings, or PE, ratio is a useful way to see what investors are willing to pay today for each dollar of current earnings. In general, faster and more reliable earnings growth, combined with lower perceived risk, can justify a higher PE multiple, while slower growth or higher uncertainty usually pulls that multiple down.
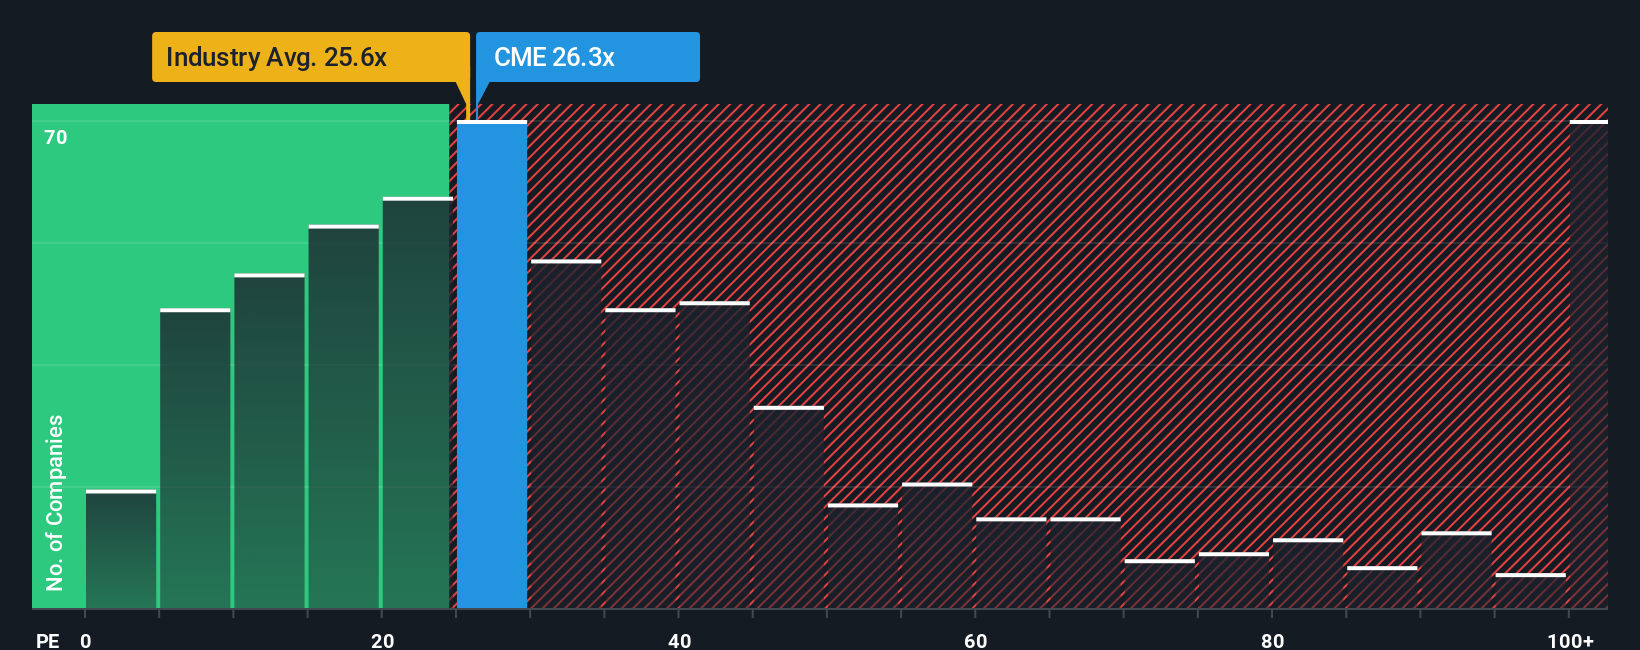
CME Group currently trades on a PE of about 25.8x. That is very similar to the wider Capital Markets industry average of roughly 25.8x, but sits below the peer group average of around 33.7x, indicating the market is not awarding CME a premium multiple versus comparable names.
Simply Wall St also calculates a Fair Ratio for CME of about 15.0x. This is a proprietary estimate of what a reasonable PE should be, after adjusting for the company’s specific earnings growth outlook, profitability, risk profile, industry positioning and market cap. Because it is tailored to CME’s fundamentals rather than broad group averages, it provides a more precise yardstick than simple peer or sector comparisons. With the current PE of 25.8x sitting well above the 15.0x Fair Ratio, the shares look expensive on this framework.
Result: OVERVALUED
PE ratios tell one story, but what if the real opportunity lies elsewhere? Discover 1446 companies where insiders are betting big on explosive growth.
Upgrade Your Decision Making: Choose your CME Group Narrative
Earlier we mentioned that there is an even better way to understand valuation, so let us introduce you to Narratives, a simple framework on Simply Wall St’s Community page that lets you tell the story behind your numbers by linking your view of CME Group’s future revenue, earnings and margins to a financial forecast, a fair value estimate, and then a clear buy or sell decision based on how that Fair Value compares to today’s Price. All of this then updates dynamically as new news or earnings arrive. For example, one investor might build a more bullish CME Narrative that leans into resilient global demand for risk management, ongoing international expansion and product innovation to justify a fair value up near the most optimistic analyst target of about $313. Another might construct a more cautious Narrative focused on rising competition, regulatory risk and lower volatility, landing closer to the most conservative target around $212. Both perspectives are easily comparable and adjustable as fresh information changes the story and, in turn, the valuation.
Do you think there's more to the story for CME Group? Head over to our Community to see what others are saying!
This article by Simply Wall St is general in nature. We provide commentary based on historical data and analyst forecasts only using an unbiased methodology and our articles are not intended to be financial advice. It does not constitute a recommendation to buy or sell any stock, and does not take account of your objectives, or your financial situation. We aim to bring you long-term focused analysis driven by fundamental data. Note that our analysis may not factor in the latest price-sensitive company announcements or qualitative material. Simply Wall St has no position in any stocks mentioned.
Have feedback on this article? Concerned about the content? Get in touch with us directly. Alternatively, email editorial-team@simplywallst.com