
How Attractive Is Ultragenyx Pharmaceutical After Recent Rare Disease Pipeline Progress?
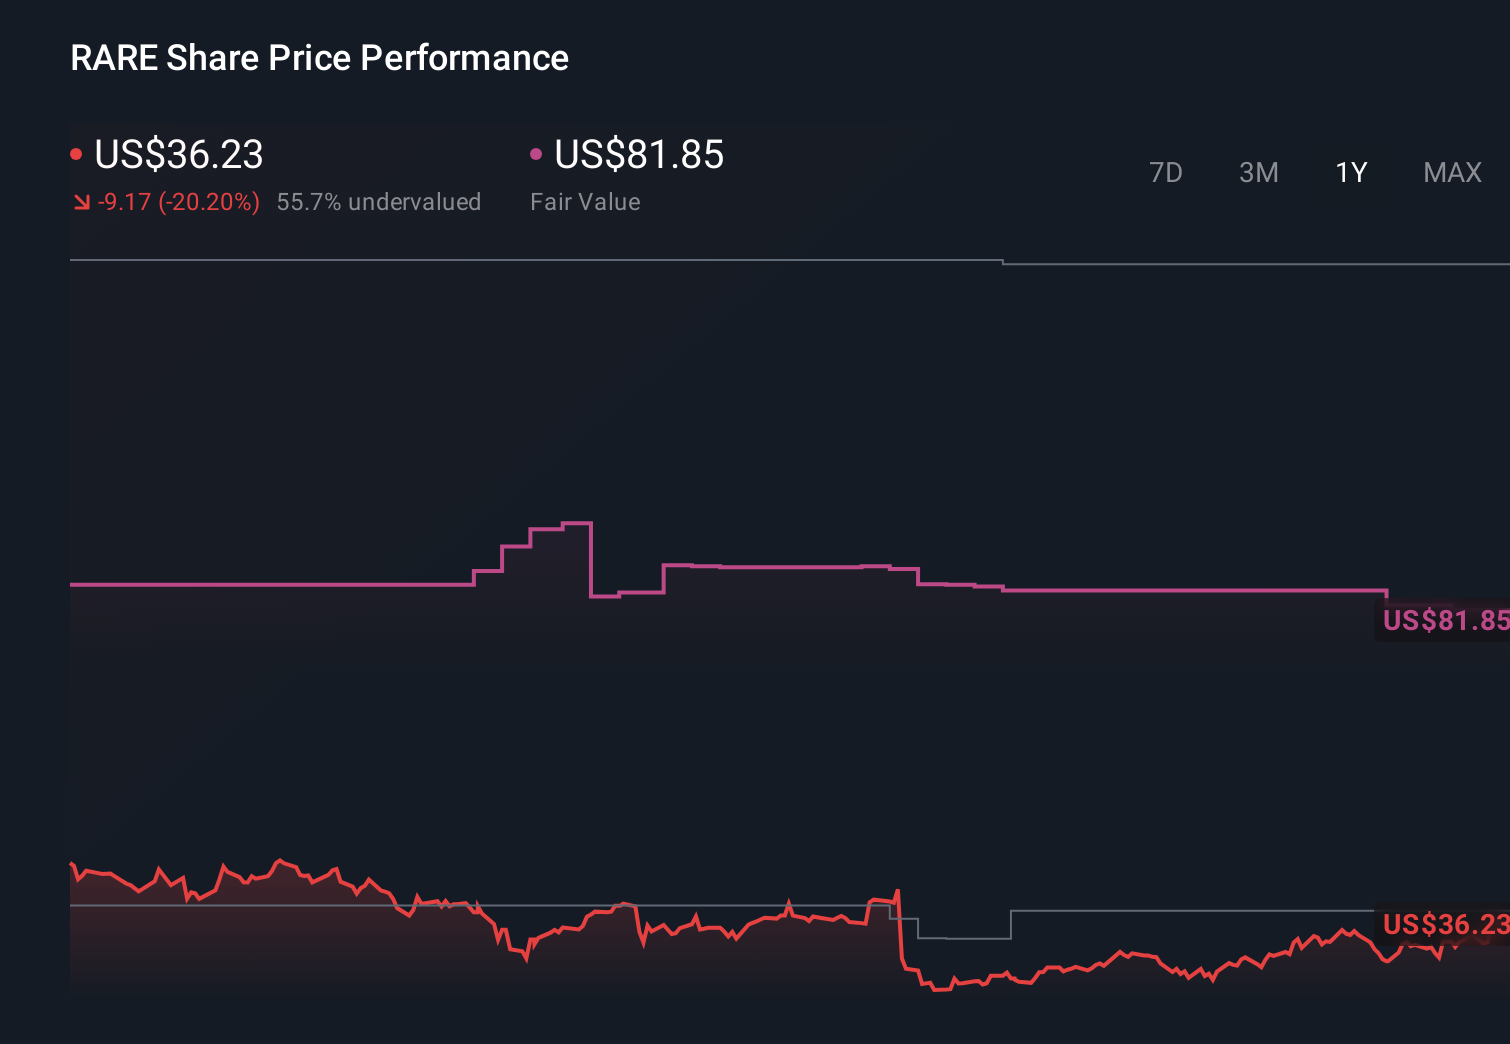
- If you are wondering whether Ultragenyx Pharmaceutical at around $36 a share is a hidden bargain or another biotech value trap, you are in the right place to unpack what the market is really pricing in.
- The stock is up about 8.3% over the last month but still down sharply over 1 year and 5 years. This pattern suggests sentiment may be shifting even while longer term holders are still deep in the red.
- Recent attention on Ultragenyx has centered on its rare disease pipeline progress and regulatory milestones, which tend to move the share price quickly as probabilities of success are reassessed. At the same time, partnerships and licensing deals in the biotech space have sharpened investor focus on which platforms the market sees as genuinely de risked versus still highly speculative.
- On our checks, Ultragenyx scores a 4/6 valuation score, suggesting the stock screens as undervalued on most but not all metrics. That makes how we value it especially important. Next we will walk through those valuation approaches in detail, and then finish with a more complete way to think about what this business could really be worth over time.
Approach 1: Ultragenyx Pharmaceutical Discounted Cash Flow (DCF) Analysis
A Discounted Cash Flow model estimates what a company is worth today by projecting its future cash flows and then discounting those back into today’s dollars. For Ultragenyx Pharmaceutical, the latest twelve month free cash flow is around $492 Million in the red, reflecting heavy investment in its rare disease pipeline.
Analyst and model projections see this swinging to positive territory over the next few years, with free cash flow expected to reach about $893 Million by 2029. Beyond the explicit analyst window, Simply Wall St extrapolates further growth, with annual free cash flows in the 10 year view rising into the low to mid single digit billions of dollars, all converted into today’s value using a 2 stage Free Cash Flow to Equity approach.
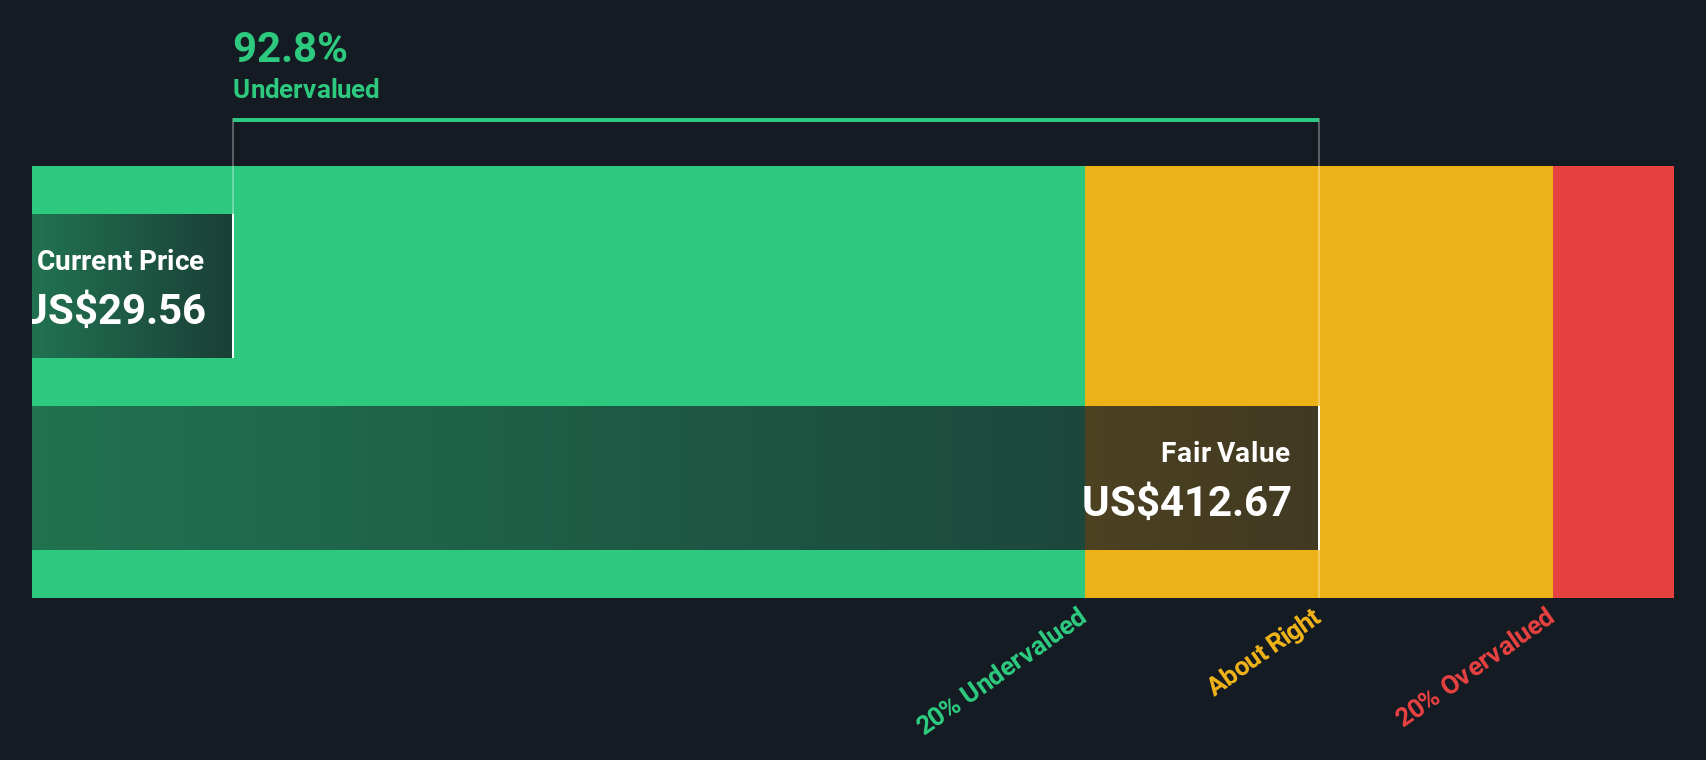
On this basis, the DCF model arrives at an intrinsic value of about $316.73 per share, implying the stock is roughly 88.6% undervalued relative to the current price near $36. In other words, the market is pricing in a lot more risk and execution uncertainty than the cash flow projections suggest.
Result: UNDERVALUED
Our Discounted Cash Flow (DCF) analysis suggests Ultragenyx Pharmaceutical is undervalued by 88.6%. Track this in your watchlist or portfolio, or discover 909 more undervalued stocks based on cash flows.
Approach 2: Ultragenyx Pharmaceutical Price vs Sales
For companies like Ultragenyx that are still loss making but generating meaningful revenue, the Price to Sales ratio is usually a more useful yardstick than earnings based metrics. Investors are effectively asking how many dollars they are willing to pay today for each dollar of current sales, given expectations for future growth and the risks of getting there.
In general, faster expected revenue growth and lower perceived risk can justify a higher sales multiple, while slower growth or greater uncertainty should pull that multiple down. Ultragenyx currently trades at about 5.50x sales, which is well below the broader Biotechs industry average of roughly 11.79x and also below the peer group average of around 12.95x. Simply Wall St’s proprietary Fair Ratio, which estimates what a reasonable Price to Sales multiple should be after accounting for factors like growth outlook, profitability profile, industry, size and risk, sits at about 2.98x for Ultragenyx.
Because this Fair Ratio is materially lower than the current 5.50x sales, the model suggests the shares screen as overvalued on a pure sales multiple basis, despite looking cheap versus peers and the wider industry.
Result: OVERVALUED

PS ratios tell one story, but what if the real opportunity lies elsewhere? Discover 1446 companies where insiders are betting big on explosive growth.
Upgrade Your Decision Making: Choose your Ultragenyx Pharmaceutical Narrative
Earlier we mentioned that there is an even better way to understand valuation, and on Simply Wall St this comes through Narratives, a simple way for you to attach a clear story about Ultragenyx Pharmaceutical to the numbers you are assuming for its future revenue, earnings, margins and fair value. This helps your view of the business flow logically from the company’s story, into a financial forecast, and then into a buy or sell decision based on how your Fair Value compares with today’s Price on the Community page that millions of investors use. Narratives are easy to set up and update, and they refresh dynamically as new information like trial data, earnings or guidance comes in, helping you decide if your thesis still holds or needs to change. For example, one Ultragenyx Narrative might lean bullish, assuming successful late stage trial readouts and a fair value near $128 per share, while a more cautious Narrative might price in regulatory or commercialization risks and land closer to $34 per share. The platform then lets you see exactly which assumptions drive those very different outcomes.
Do you think there's more to the story for Ultragenyx Pharmaceutical? Head over to our Community to see what others are saying!
This article by Simply Wall St is general in nature. We provide commentary based on historical data and analyst forecasts only using an unbiased methodology and our articles are not intended to be financial advice. It does not constitute a recommendation to buy or sell any stock, and does not take account of your objectives, or your financial situation. We aim to bring you long-term focused analysis driven by fundamental data. Note that our analysis may not factor in the latest price-sensitive company announcements or qualitative material. Simply Wall St has no position in any stocks mentioned.
Have feedback on this article? Concerned about the content? Get in touch with us directly. Alternatively, email editorial-team@simplywallst.com